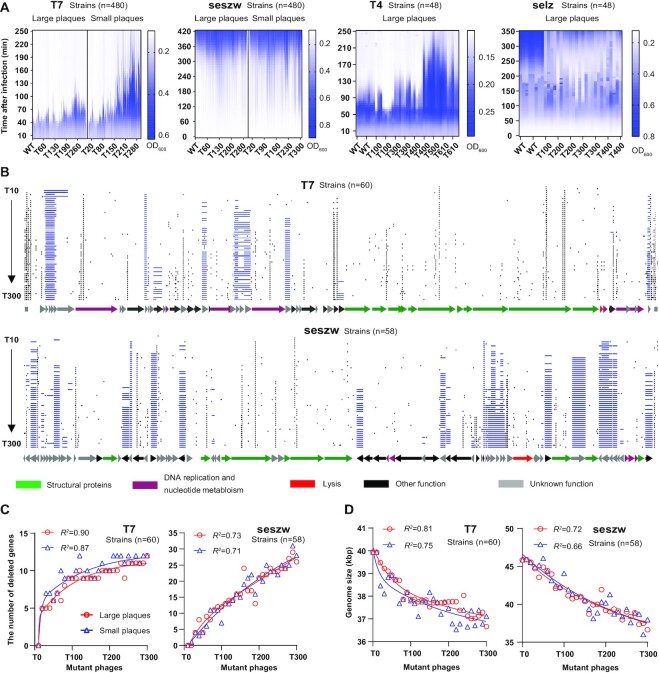
Figure 4.
Phenotypes and genotypes of the isolated mutant phages. (A) Concentrations of the cells co-cultured with the isolated mutant phages shown as OD600 values. L, large plaques; S, small plaques. Tn, the nth transfer. The vertical axis displays the culture time, and the horizontal axis represents the isolated mutant phages sampled at the nth transfer. We use killing time to evaluate the ability of phages to kill their hosts. For the phages seszw and selz, phage-resistant bacteria emerged rapidly and caused an increase in OD600. The longer time required for the OD600 of S. enterica to sharply increase (seszw, OD600<0.2: selz, OD600<0.4) indicates the higher killing abilities of the phages. (B) Genome maps of the T7 and seszw mutant phages. Blue lines show gene deletion regions. Black lines show point mutations. Arrows represent genes; the directions in which the arrows point correspond to the directions of transcription and translation. (C) Increase in the number of genes that were absent from the genomes of the isolated mutant phages as a function of the number of transfers. The red and blue lines show the regression coefficients between the number of transfers of the phages and the number of mutated genes accumulated in the genomes of their large- and small-plaque mutants, respectively. (D) The red and blue lines show the regression coefficients between the number of transfers and the sizes of the genomes of the isolated mutant phages.

