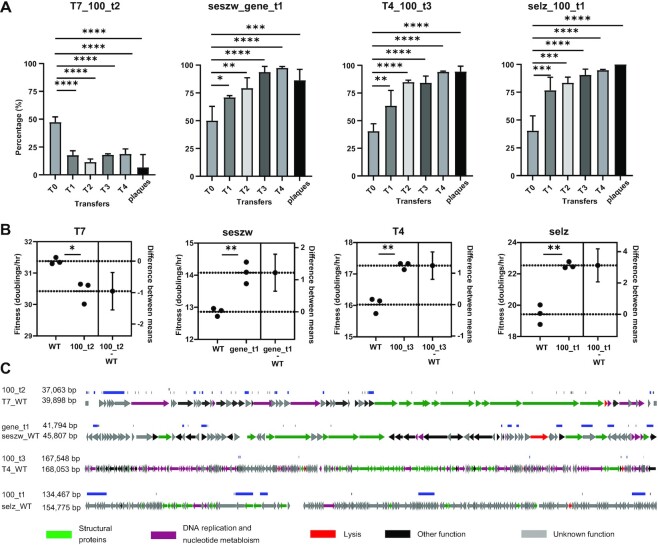
Figure 5.
Characterization of genome-reduced mutant phages with high infectious efficiency. (A) Infection competition between the WT phages and the corresponding optimal mutants against their hosts. Tn, the nth transfer, The vertical axis represents the abundance of the mutant phages in the population. Plaques: the plaques were picked randomly from the last transfer products (double layer agar plate) and identified by PCR. The significance was determined using unpaired t-test (50). *P <0.02; **P <0.005; ***P <0.001; ****P <0.0001. (B) Fitness of the WT phages and the corresponding optimal mutants. The data are shown as the mean ± standard deviation from three repeated experiments. The significance was determined using unpaired t-test (50). *P = 0.01; **P <0.005. Difference between means: (mutant–WT) ± standard error of the mean. (C) Genome maps of the mutant phages that displayed high infectious efficiency. Blue lines show the gene deletion regions, and black lines show the point mutations. Arrows represent genes; the directions in which the arrows point correspond to the directions of transcription and translation.

