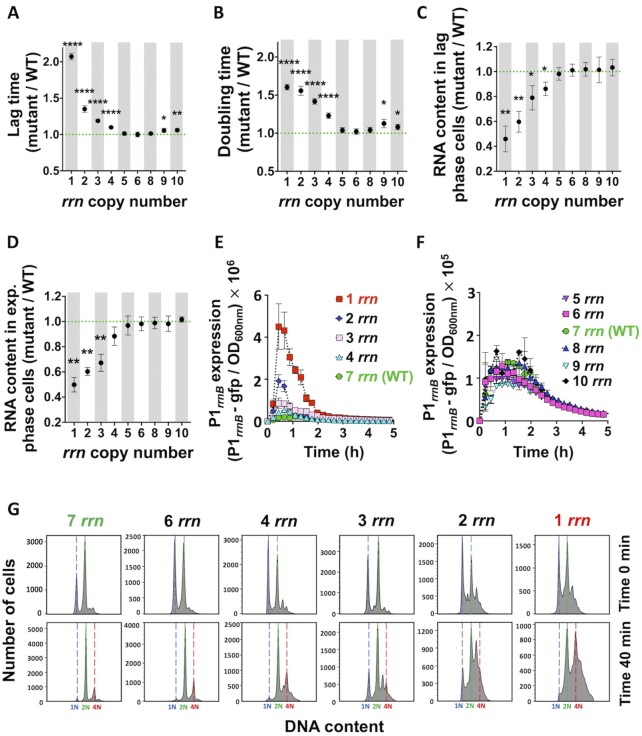
Figure 1.
Growth, RNA content, P1rrnB expression and DNA replication of cells having different rrn operon copy numbers growing in LB medium. (A) Lag time and (B) doubling time, calculated from the growth curves (see Supplementary Figures S1A1, S3). Total RNA content in (C) lag phase and (D) exponential phase cells. (A-C) Each dot represents the mean value (± SD) from three independent experiments. Asterisks show significant difference compared to the WT (t-test: *P < 0.05, **P < 0.01, ****P < 0.0001). (E-F) P1rrnB-gfp expression during first 5 h of growth. Each data point represents the mean value (± SD) from three independent experiments. (G) Lag phase cells were treated simultaneously with rifampicin and cephalexin (first row; time 0), or 40 min with cephalexin only, and then also with rifampicin (second row). DNA content was measured after 90 min of incubation with both antibiotics. Number of genome equivalents (N) was calculated using stationary phase, 1N cells, as a reference. The results are representative of three independent experiments.

