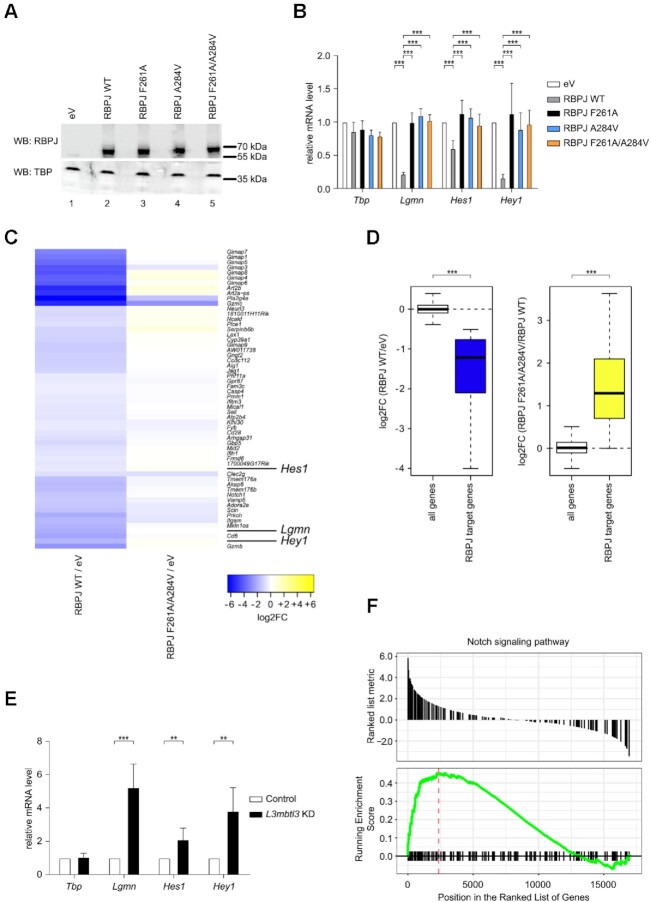
Figure 7.
Characterization of RBPJ/L3MBTL3 interactions in mature T (MT) cells. (A) RBPJ wild type (WT) and single or double mutants are efficiently expressed in mature T (MT) cells depleted of endogenous RBPJ. MT cells depleted of RBPJ were infected with viruses carrying plasmids encoding for RBPJ WT, F261A, A284V, F261A/A284V or empty vector (eV) as control. Nuclear extracts were analyzed by western blotting (WB) with the indicated antibody. TBP was used as loading control. (B) Expression of Notch target genes is downregulated by RBPJ WT but not by the single or double mutants in MT cells depleted of endogenous RBPJ. MT cells depleted of RBPJ were infected with viruses carrying plasmids encoding for RBPJ WT, F261A, A284V, F261A/A284V or empty vector (eV) as control. Upon RNA extraction and reverse transcription, cDNAs were analyzed by qPCR using assays specific for Tbp, Lgmn, Hes1 or Hey1. Data were normalized versus the housekeeping gene GusB. The mean ± SD of seven experiments is shown (***P < 0.001, unpaired Student's t test). (C) Heatmap shows gene expression changes after rescue of RBPJ null MT cells with wild type RBPJ or mutant RBPJ. Genes showing significant repression (FDR < 0.05 and log2FoldChange < –0.5) after rescue with RBPJ WT (left, RBPJ WT/eV) do lack such response when rescuing with RBPJ F261A/A284V (right, RBPJ F261A/A284V/eV). MT cells depleted of RBPJ were infected with viruses carrying plasmids encoding for RBPJ WT, F261A/A284V or empty vector (eV) as control. Upon RNA extraction samples were analyzed by RNA-Seq. (D) Left: Box plot representation of the log2-transformed gene expression changes (RBPJ WT / eV) from all genes and RBPJ target genes defined as those genes downregulated upon rescue with RBPJ WT. Right: log2-transformed gene expression changes of all genes (RBPJ F261A/A284V / RBPJ WT) and the RBPJ target genes (***P < 0.001, Wilcoxon rank sum test). (E) L3MBTL3 knockdown in MT cells leads to upregulation of Notch target genes. MT cells were infected with shRNAs directed against L3MBTL3 or scramble (Control) as control. Upon RNA extraction and reverse transcription, cDNAs were analyzed by qPCR using assays specific for Tbp, Lgmn, Hes1 or Hey1. Data were normalized versus the housekeeping gene GusB. Shown is the mean ± SD of five experiments (**P < 0.01, ***P < 0.001, unpaired Student's t test). (F) Visualization of the gene set enrichment analysis (GSEA) comparing L3MBTL3 KD and the scramble (Control) sample indicating significant and concordant induction of genes belonging to the GO term (biological process) ‘Notch signaling pathway’ (adjusted P-value = 0.0128).

