Figure 1.
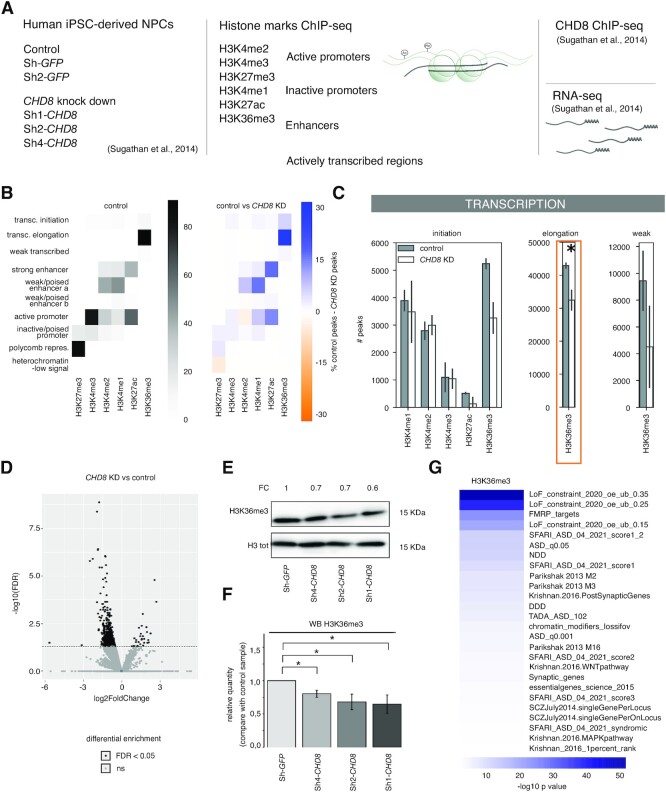
CHD8 suppression significantly impacts on histone H3K36me3 enrichment at transcriptional elongation sites. (A) Schematic representation of the study design and integrative approach used in this work. Human iPSC-derived NPCs (hiNPC) knocked down for CHD8 (Sh1-, Sh2- and Sh4-CHD8) and control hiNPCs (Sh-GFP and Sh-GFP2) (11), were analyzed via ChIP-seq for six histone marks representative of different chromatin regions: active promoters (H3K4me2 and H3K4me3), inactive promoters (H3K27me3), enhancers (H3K4me1 and H3K27ac) and actively transcribed regions (H3K36me3). ChIP-seq results were subsequently integrated with CHD8-binding sites and available transcriptomics (RNA-seq) datasets obtained from the same model system (11). (B) The heatmaps represent 10 different chromatin states (1, transcriptional initiation; 2, transcriptional elongation; 3, weakly transcribed; 4, strong enhancer; 5, weak/poised enhancer a; 6, weak/poised enhancer b; 7, active promoter; 8, inactive/poised promoter; 9, polycomb repressed; 10, heterochromatin/low signal), determined by the combination of different histone marks in control hiNPCs as defined by ChromHMM (48). The distribution of histone mark peaks across different chromatin states (see the Materials and Methods for details) is presented as a percentage of the total, and is color-coded in the heatmap (left). On the right, the heatmap describes the difference in number of peaks between two experimental conditions (controls versus CHD8 knockdown). Chromatin states enriched in the control are indicated in blue and chromatin states enriched in CHD8 knockdown in orange. H3K36me3 in transcriptional elongation is identified as the most affected chromatin state. (C) The bar plots represent the number of peaks for each histone mark identified at transcriptional initiation (left), elongation (center) and weakly transcribed (right) genomic regions. Gray bars indicate controls (n = 2, Sh-GFP and Sh-GFP2) and white bars refer to CHD8 knockdown (n = 2, Sh2-CHD8 and Sh4-CHD8). H3K36me3 peak loss upon CHD8 suppression was significant at the transcriptional elongation states (two biological replicates, t-test, P <0.05). (D) The volcano plot reports differentially enriched peaks for H3K36me3 as detected by DiffBind (50,51). Peaks significantly different (FDR <0.05) are shown in black. Peaks not significantly different (ns, FDR >0.05) are shown in gray. The dashed horizontal line represents FDR = 0.05. Peaks enriched in CHD8 knockdown compared with controls are represented on the right side of the plot, with positive log2(FC). Peaks depleted in CHD8 knockdown (enriched in controls) are represented on the left side of the plot, with negative log2(FC). (E) A representative image illustrating total histone levels (H3K36me3 and H3 total), comparing control (Sh-GFP) and CHD8 knockdown clones (Sh1-CHD8, Sh2-CHD8 and Sh4-CHD8) from western blotting experiments. Levels of H3K36me3 reduction are indicated as FC compared with control Sh-GFP. Comparable amounts of total protein were loaded. Total histone H3 was used as loading control. H3K36me3 exposure = 20 s; H3 total exposure = 20 s. (F) The bars in the chart represent normalized H3K36me3 (versus total histone H3) values relative to Sh-GFP controls. Mean values ± SE from independent biological replicates (n = 4 for Sh4-CHD8 and n = 6 for the other samples) are plotted. A t-test for two mean populations was performed. *P ≤0.05. (G) The heatmap represents gene set enrichment P-values in –log10 scale for all genes losing H3K36me3 (as in D) following CHD8 knockdown. Gene lists related to ASD, neurodevelopment, co-expression modules in brain and intolerance to loss of function were tested for enrichment as described in the Materials and Methods. The full gene list description and enrichment results are available in Supplementary Table S1.

