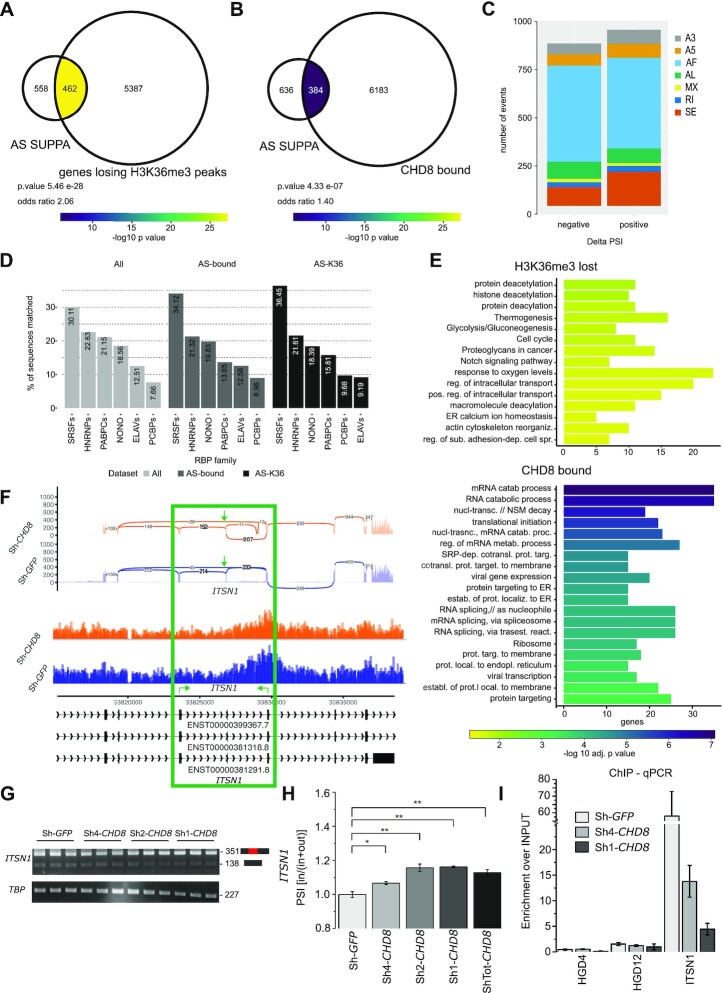
Figure 3.
CHD8 suppression-elicited reduction in H3K36me3 correlates with significant alterations in RNA AS. (A, B) Venn diagrams represent the overlap between genes losing H3K36me3 peaks following CHD8 knockdown (losing H3K36me3) and genes presenting altered AS events as detected by SUPPA (AS SUPPA) (A), and the overlap between genes bound by CHD8 (CHD8-bound) and genes presenting altered AS events as detected by SUPPA (AS SUPPA) (B). The number of genes for each condition is indicated. The enrichment significance for each intersection is computed by Fisher's exact test and represented by colors. Color-coded key: –log10(P-value). The P-value and odds ratio are reported. (C) The stacked bar plot represents the 1862 differential AS events detected by SUPPA, distributed by event type. SE, skipped event; RI, retained intron; MX, mixed event; A3, alternative 3′; A5, alternative 5′; AF, alternative first exon; AL, alternative last exon. (D) The bar plot reports the overlap between sequences located ± 100 bp from all differentially spliced exons (all, light gray), differentially spliced and bound by CHD8 (AS-bound, gray) or differentially spliced and losing H3K36me3 (AS-K36, dark gray) and known RBP family motif matching. The six most representative RBP families are reported. The exact percentage of sequences matched is indicated within each bar. (E) The bar plot represents GO biological process and KEGG pathways terms significantly enriched in genes presenting altered AS events as detected by SUPPA and losing H3K36me3 peaks following CHD8 knockdown (H3K36me3 lost, top panel) or bound by CHD8 (CHD8 bound, bottom panel). The bars are ordered according to adjusted P-value in –log10 scale; the x-axis represents the number of genes enriched for each term. (F) The image displays sashimi plots (top), chromatin tracks of H3K36me3 enrichment (middle) and ENSEMBL transcript IDs (bottom) for the ITSN1 locus. Sh-CHD8 samples versus Sh-GFP controls are color-coded (in orange and blue, respectively). Numbers of junction reads are depicted on the top panel. The green box and green arrows highlight the skipped exon event. Green arrows on the bottom panel show the location of primers used to analyze the skipped exon event. (G) Gel images represent PCR products obtained using ITSN1 (top) and TBP reference primers (bottom). Using the ITSN1 primer set, two amplicons are obtained corresponding to target exon inclusion (351 bp) and exon skipped (138 bp). (H) The bar graph reports Image-J PCR band quantification of ITSN1 transcripts normalized using TBP as the reference gene. PSI (% spliced in) is obtained by calculating the ratio between ITSN1 spliced in transcripts and the sum of spliced in plus spliced out events: PSI [in/(in + out)]. Means ± SE are shown. One-tail t-test was performed with NS P >0.05, *P ≤0.05, **P ≤0.01. (I) The bar plot shows CHD8 enrichment over the INPUT following CHD8-ChIP qPCR quantification. ITSN1 genomic primers (green arrows in F) and gene desert control regions (HGD4 and HGD12) were amplified for Sh-CHD8 and Sh-GFP conditions.

