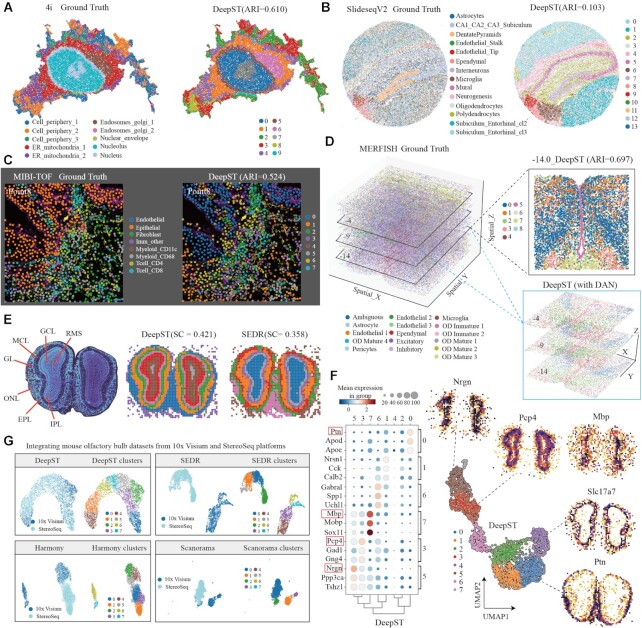
Figure 5.
DeepST works on various spatial omics data independent of platforms. (A) Visualization of subcellular molecular profiles using 4i (iterative indirect immunofluorescence imaging), plotted in spatial coordinates (left, 25 415 observations/pixels and 43-plex proteins, annotated(9) 10-cell states), and spatial domain identification using DeepST was plotted (right). ER, endoplasmic reticulum. (B) Visualization of SlideseqV2 dataset (41 786 sub-cells and 4000 genes) of mouse hippocampus with cell-type annotations (left, annotated by (A). Goeva and Macosko (50)) and spatial domains of DeepST (right). (C) Visualization of imaging-based molecular MIBI-TOF(10) dataset (3309 pixels and 36 proteins) with annotations (left, the point 8 section) and spatial domains of DeepST (right, ARI = 0.524) (D) Visualization in 3D coordinates in the whole MERFISH(11) dataset (left, annotated) and spatial domains of three consecutive imaging-based molecular slides (lower right, including –4, –9 and –14 layers; using DeepST integrated methods, see Materials and Methods in details). Spatial domain identification using DeepST on –14 imaging slide (top right; ARI = 0.697). (E) Nissl-stained coronal section of mouse olfactory bulb (left). Visualization of spatial domains of DeepST (middle) and SEDR (right). RMS, rostral migratory stream; ONL, olfactory nerve layer; IPL, internal plexiform layer; GL, glomerular layer; MCL, mitral cell layer; GCL, granule cell layer; EPL, external plexiform layer. (F) Dotplot of the top 3 DEGs of domains 0, 1, 6, 7, 3 and 5 on mouse olfactory bulb by Stereoseq (left). Scatter plot of spatial clustering generated by DeepST (right, including genes Nrgn, Pcp4, Mbp, Slc17a7 and Ptn). (G) Visualization of integrated mouse olfactory bulb datasets from two ST technologies (10 × Genomics Visium and Stereoseq) using DeepST, SEDR, Harmony(17) and Scanorama(18), respectively.

