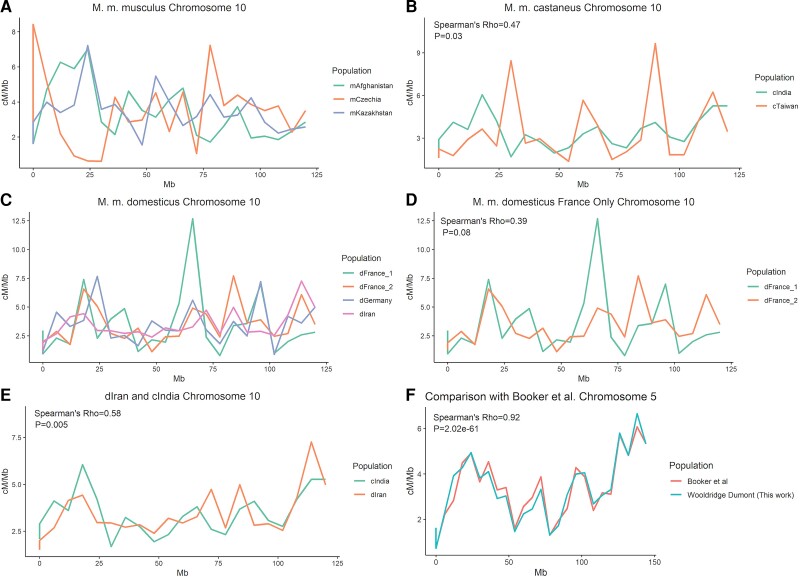
Fig. 3.
Comparisons of broad-scale recombination maps across M. musculus populations in cM/Mb units. (A) Chromosome 10 for all M. m. musculus populations, (B) chromosome 10 for all M. m. castaneus populations, (C) chromosome 10 for all M. m. domesticus populations, (D) chromosome 10 for only the two M. m. domesticus populations from France, (E) chromosome 10 for the two most highly correlated populations, cIndia and dIran, and (F) a comparison of the chromosome 5 cIndia map with the map generated from the same data by Booker et al. Chromosome 5 was selected for (F) because the Spearman's correlation for this chromosome is similar to the mean correlation for all chromosomes. Spearman's Rho and associated P values only shown for panels with one comparison.

