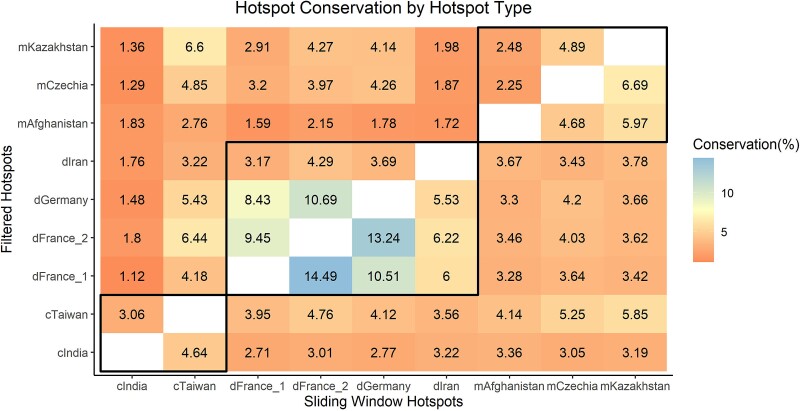
Fig. 5.
Few hotspots are shared between any two populations. The percentage of hotspots conserved between each population pair is shown as a heat map, with filtered hotspots displayed above the diagonal and sliding window hotspots below the diagonal. Comparisons within the black boxes are intra subspecies comparisons.

