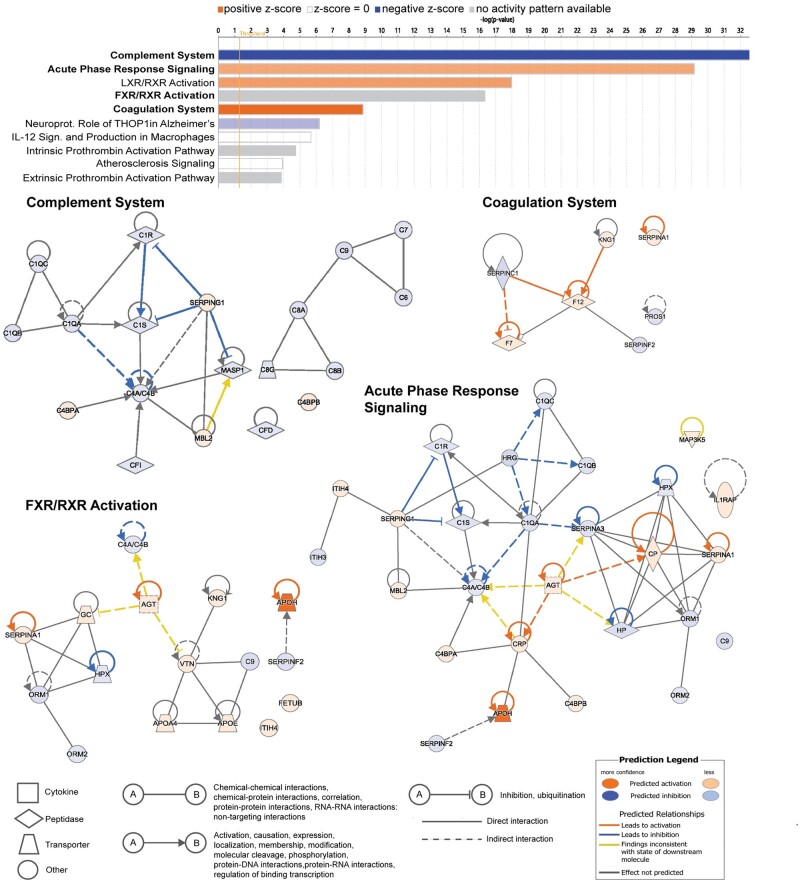
Figure 4.
Pathway and network analyses of changing proteins during EE + DNG use. Pathway analysis of the 10 pathways most affected during 9-week use of ethinylestradiol + dienogest (EE + DNG). Graph shows category scores; ‘threshold’ indicates the minimum significance level (scored as −log(P-value) from Fisher’s exact test, set here to 1.25). A positive z-score (orange bar) predicts activation of the pathway, whereas a negative (blue bar) predicts inhibition. The analysis was performed with QIAGEN Ingenuity Pathway Analysis (IPA) software. The four pathways in bold text are depicted below as networks. FXR, farnesoid X receptor; LXR, liver X receptor; RXR, retinoid X receptor.

