
Fig. 1.
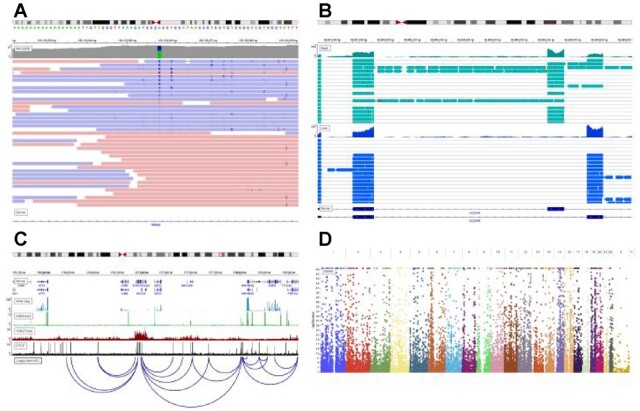
Example igv.js screenshots. (A) NGS sequence alignment pileup in the region of a putative SNP indicates strand bias (https://tinyurl.com/y9n6dyw9). (B) RNA-Seq pileups from two tissues illustrate alternative splicing (https://tinyurl.com/ybo547uf). (C) Epigenetic marks and transcription factors correlate with loop calls from HiC data (https://tinyurl.com/y75465od). (D) Manhattan plot from whole-genome association studies (https://tinyurl.com/ydhakvy4)