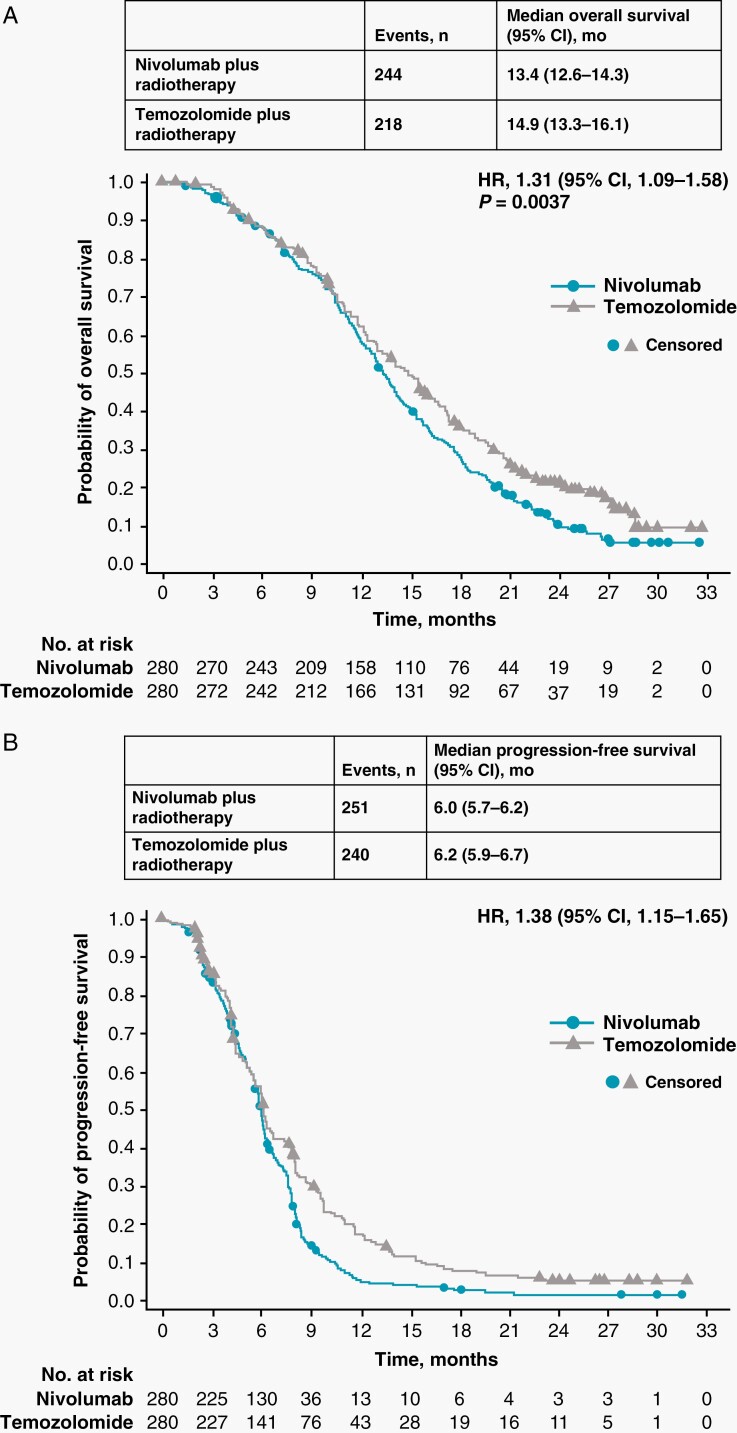
Fig. 2.
OS and PFS in all patients. (A) Shows the number of events, median OS, and the Kaplan-Meier curve for OS in all patients treated with nivolumab plus radiotherapy or temozolomide plus radiotherapy. (B) Shows the number of events, median PFS, and the Kaplan-Meier curve for PFS per investigator assessment in patients treated with nivolumab plus radiotherapy or temozolomide plus radiotherapy. Symbols indicate censored observations. Hazard ratios and 95% CIs were estimated using a Cox proportional hazards model. OS, overall survival; PFS, progression-free survival.

