Fig. 3.
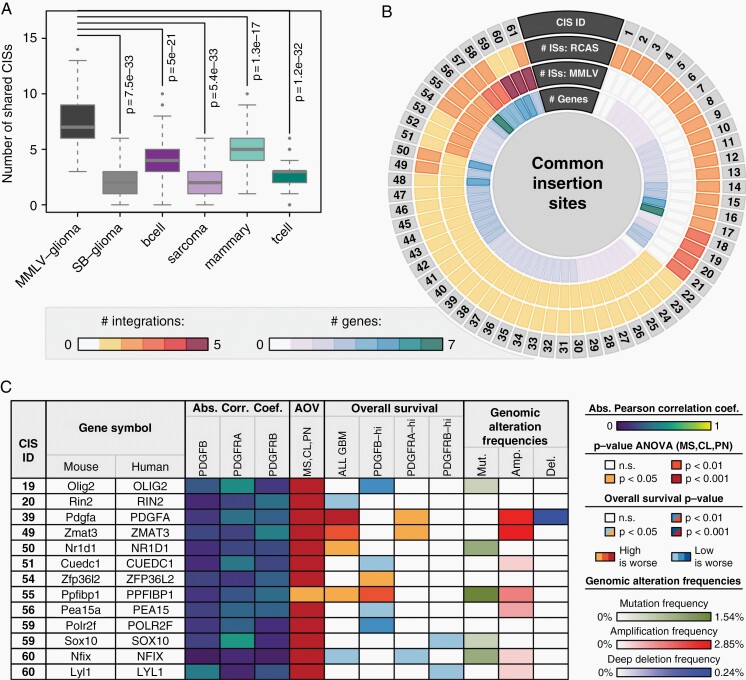
Characterization of RCAS-PDGFB CISs. (A) Box-and-Whisker plot comparing the number of shared CISs between the RCAS-PDGFB model and six other forward genetic screens. Each Box-and-Whisker object represents 100 values, each obtained by randomly selecting 100 insertion sites from the respective model and computing the corresponding number of shared CISs upon integration with all 938 RCAS-PDGFB insertions. (B) Circos plot visualizing for each identified CIS between RCAS-PDGFB and MMLV-PDGFB the number of ISs in the RCAS and MMLV screens, respectively, and the number of genes in the vicinity. Only CISs with at least one IS in the current RCAS-PDGFB screen were considered. (C) Molecular and clinical characterization of human orthologs for 13 top candidate genes from (B) using GBM data. The displayed correlations indicate Pearson’s correlation coefficient of the tagged gene expression with PDGFB, PDGFRA, or PDGFRB, respectively, with the value representing the maximum absolute value observed when computing the correlation either among all patients or within each subtype separately. The AOV column indicates the P-value of an ANOVA of the gene expression values between GBM subtypes. The OS columns indicate the log-rank P-value and direction of a survival difference between samples with high and low expression of the tagged gene, either across all samples or within PDGFB-high, PDGFRA-high, or PDGFRB-high subsets. See also Supplementary Figures 7–11. Genomic alteration data was obtained from the GBM dataset in the TCGA portal (from 421 patient samples) and visualized frequencies were calculated as described in the Supplementary Material under GBM Patient Data.

