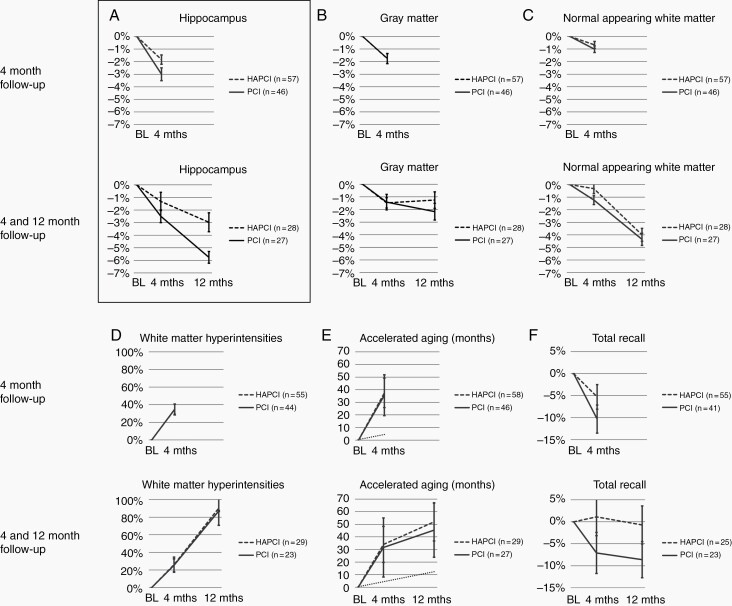
Fig. 2.
Time × Group analyses for 4-month follow-up and 4- and 12-month follow-up. For clarity, the figure shows percentage change compared to pre-(HA-)PCI baseline (BL) measurement. Statistics as shown in Table 2 were performed on raw data. Panel A shows the primary outcome measure, hippocampal volume. For accelerated aging (panel E), chronological aging is shown as a dotted line as a reference. See text for details.

