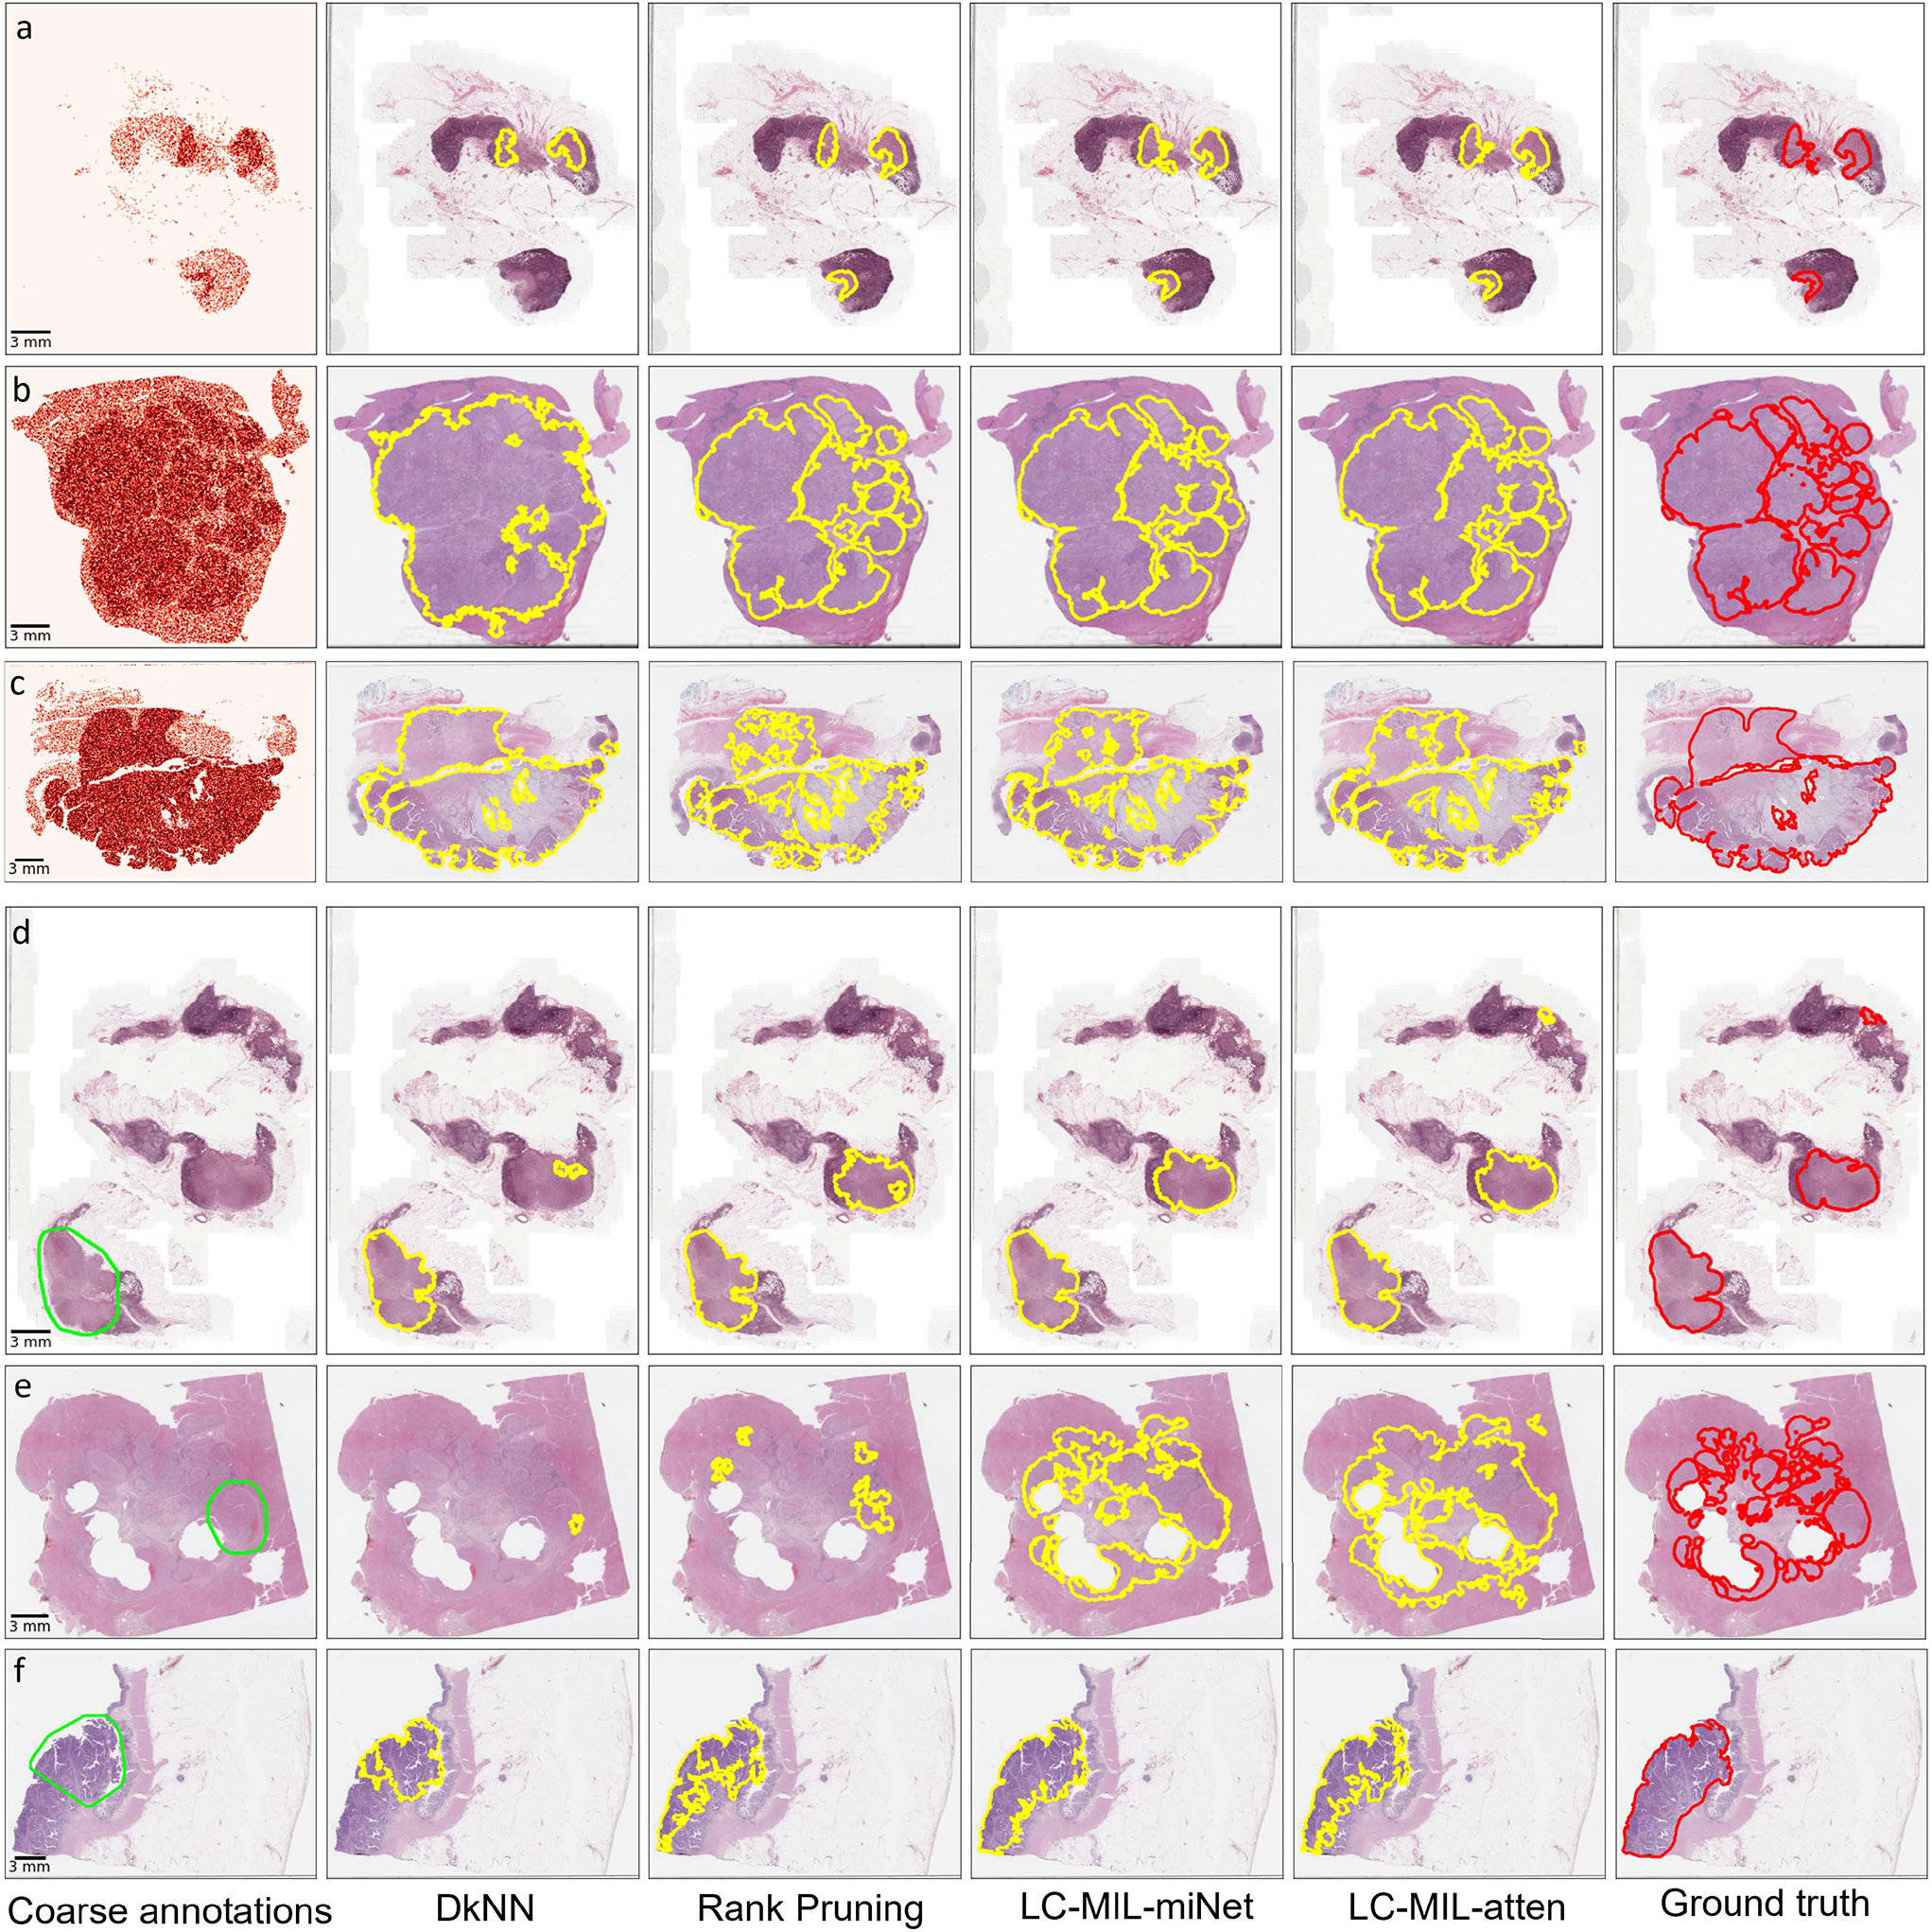
Fig. 7. Examples of synthetic coarse annotations and refinement.

(a-c) S-I: synthetic coarse annotations generated by uniformly flipping patches; (d-f): S-II: synthetic coarse annotations generated by omitting small lesions. Among those examples, (a) and (d) are from CAMELYON16, (b) and (e) are from PAIP2019, (c) and (f) are from PAIP2020. From left to right, six versions (coarse annotations (1st column, heatmap/lime lines); predicted contours using DkNN (2nd column, yellow lines); predicted contours using Rank Pruning (3rd column, yellow lines); predicted contours using LC-MIL-miNet (4th column, yellow lines)); predicted contours using LC-MIL-atten (5th column, yellow lines)); ground truth (6th column, red lines)) of cancerous region contours are shown.
