Figure 3.
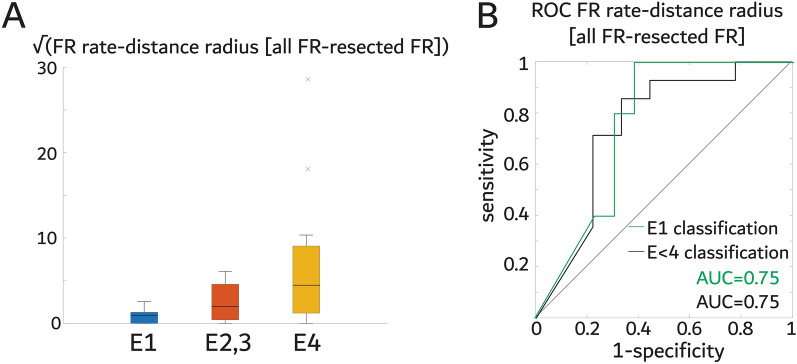
The spatial FR graph theoretical measure the FR rate-distance radius difference between all FR generating contacts minus FR generating contacts in resected regions distinguishes seizure free patients (E1) and seizure improved patients (E1-3). (A) Box plot of the square root of the difference of the FR rate-distance radius between all FR generating contacts and only resected FR generating contacts stratified by Engel class (E). The square root is used for visualization purposes only (raw values, spearman rank correlation p < 0.05). (B) Receiver operating characteristic curve (ROC) of the raw difference of the FR rate-distance radius difference between all the FR generating contacts and the FR generating contacts in the resected regions for classifying seizure free patients, and improved patients.

