
Fig. 5. In vivo light scattering spectroscopic differentiation of bile duct malignancy in 29 subjects.
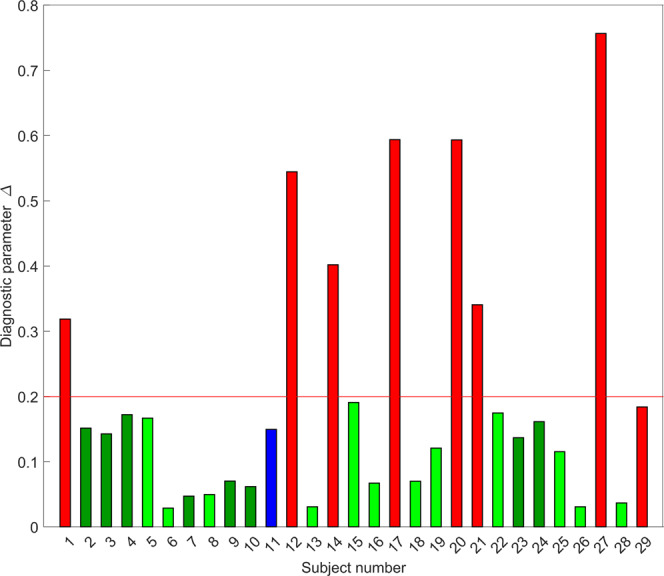
The color of the bars represents the clinical diagnosis. Light green subjects with benign bile duct, dark green—benign with inflammation, blue—low-grade dysplasia, and red—high-grade dysplasia or cancer. The bar heights represent the light scattering spectroscopy based diagnostic parameter. The red line at 0.2 represents the high-grade dysplasia and cancer diagnostic cutoff established earlier in pancreatic cysts33.