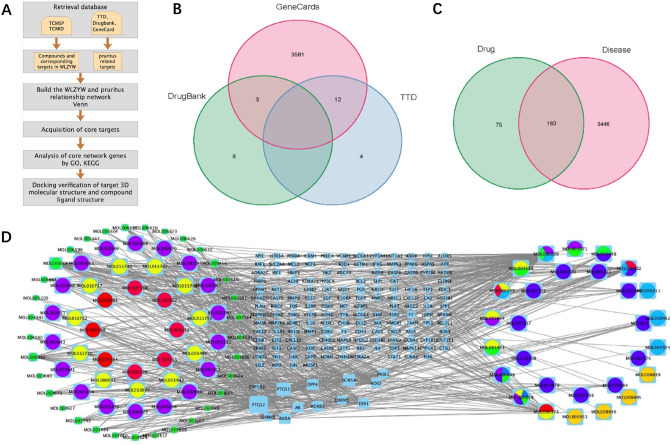
Figure 1.
Regulatory networks of WLZYW components correspond to potential pruritus targets. (A) Schedule of Network Pharmacology. (B) Venn Diagram of Pruritus Targets. (C) The intersection of WLZYW components targets and pruritus targets. (D) WLZYW potential targets pool network. The light blue quadrilateral in the center represents 160 coincident targets of WLZYW and pruritus. The circles on each side represent the compounds, one color is one component. Visualization via Cytoscape 3.8.0.

