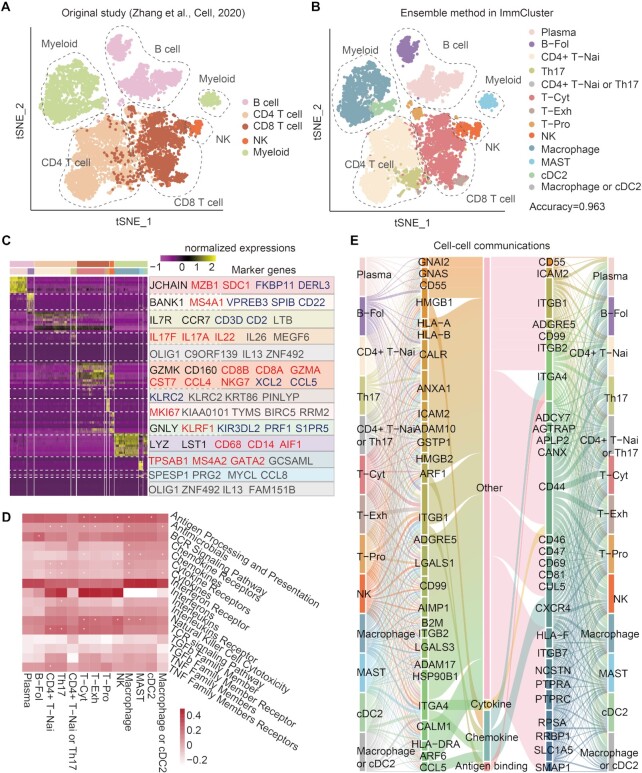
Figure 3.
Case study of scRNA-Seq data analysis based on ImmCluster. (A) TSNE plot showing the cell annotations from the original study. (B) TSNE plot showing the cell annotations based on the ensemble method in ImmCluster. (C) Heat map showing the expressions of marker genes in various cell types. Genes marked with black are from the original study, marker genes manually curated from literature are shown in red, blue indicates genes reported by recent literature, and genes highly expressed in specific cell types are shown in grey. (D) Functional pathways enriched by genes highly expressed in cell types. Heat map showing the ssGSEA scores and *P < 0.05 for hypergeometric tests. (E) Cell–cell communications mediated by ligand–receptor pairs.

