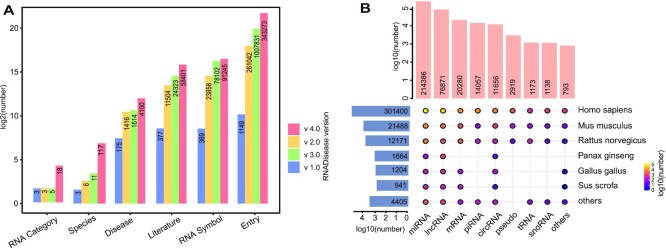
Figure 4.
Statistics of RNADisease v4.0. (A) The features and development across the RNADisease versions. Different colors represent versions of RNADisease over the decade. (B) The distribution of experimentally validated RNA-disease associations of 18 types of RNA in 117 species. Orange bars represent the number of RNA-disease entries in each RNA type, blue bars stand for the number of RNA-disease entries in each species, The color of the dots in the bubble plot represents the number of RNA-disease entries in a specific species-RNA type.

