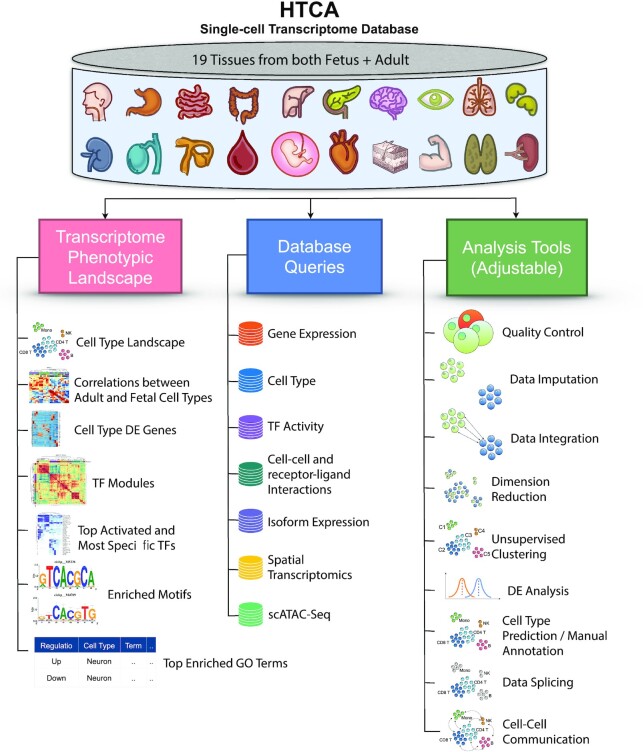
Figure 1.
Schematic diagram of the HTCA database portal. HTCA incorporated phenotypic assessments from 19 adult tissues and their matching fetal tissues to form a single-cell transcriptome database. The database consisted of three main categories, namely tissue-wise phenotypic landscapes, database queries, and analysis tools.

