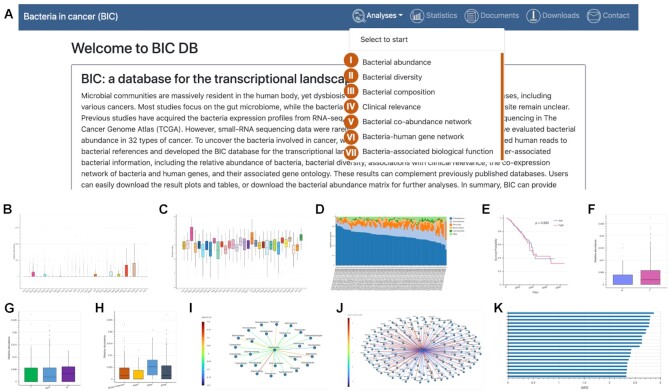
Figure 4.
BIC user interface and analysis modules. (A) The user interface and analysis modules. (B, C) Modules I and II show the relative abundance and diversity of bacteria across cancers. (D) Module III shows the bacteria composition. (E–H) Module IV shows the clinical relevance, such as overall survival, and relative abundance compared in different groups (tumor versus adjacency normal; tumor stages; races). (I) Module V shows the bacteria co-abundance network. (J) Module VI shows the bacteria-correlated human gene expression network. (K) Module VII shows the bacteria-associated biological functions.

