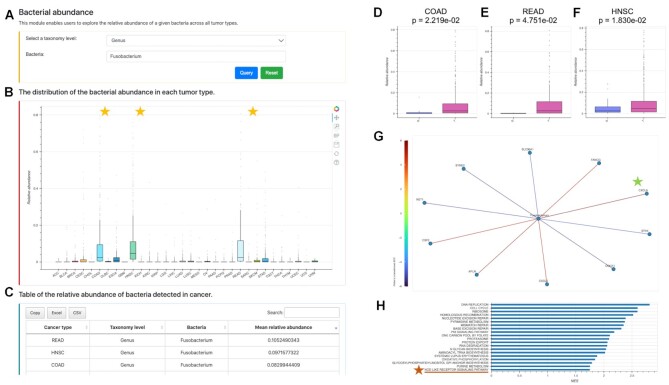
Figure 5.
Query examples of the analysis modules in BIC. (A–C) Query of Fusobacterium at the genus level and the output distribution plot and tables for the abundance of Fusobacterium across cancer types in the bacteria abundance module. (D–F) The relative abundance of Fusobacterium in tumor is significantly higher than in the adjacent normal tissues in COAD, READ and HNSC with the clinical relevance module. (G) The bacteria-human gene network module displays the z-scores between Fusobacterium and the top 10 correlated genes in COAD. (H) The bacteria-associated biological function module displays the top 20 Fusobacterium-associated KEGG pathways in COAD.

