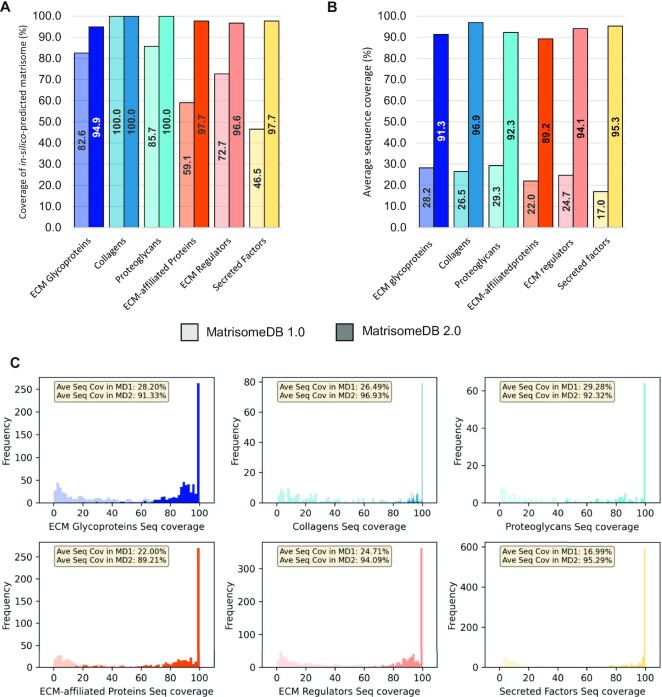
Figure 2.
The horizontal expansion of MatrisomeDB results in near complete coverage of the matrisome and of matrisome protein sequences. (A) Bar graph represents, for each matrisome category, the percentage of the in-silico-predicted human matrisome supported by experimental evidence in MatrisomeDB 2.0. Lower bars (lighter shades) indicate coverage in MatrisomeDB 1.0, upper bars (darker shades) indicate the coverage achieved in MatrisomeDB 2.0. (B) Bar graph represents, for each matrisome category, the average protein sequence coverage (%) in MatrisomeDB 1.0 (lighter shades) and in MatrisomeDB 2.0 (darker shades). (C) Histograms represent, for each matrisome category, the frequency of average protein sequence coverage (%) between MatrisomeDB 1.0 (lighter shades) and MatrisomeDB 2.0 (darker shades).

