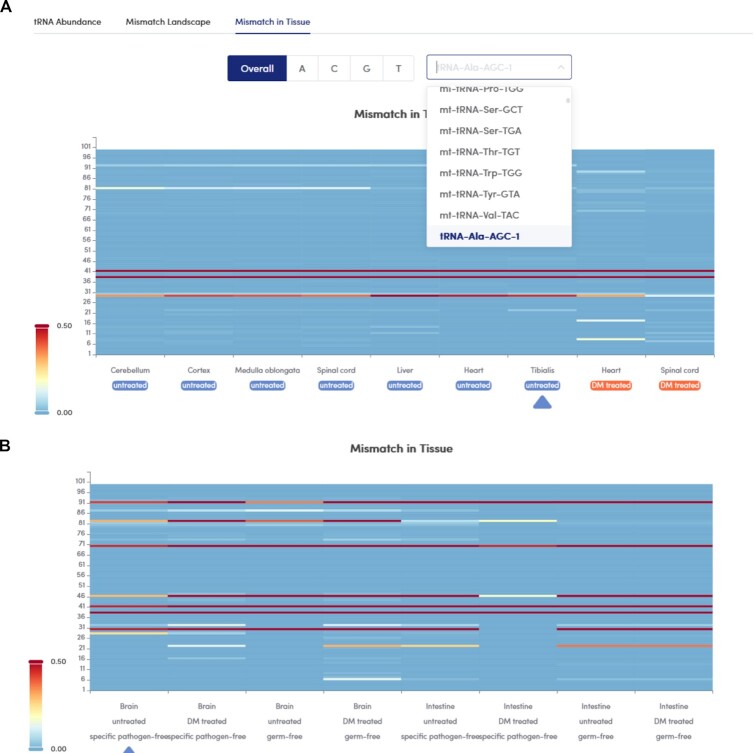
Figure 3.
Modification profiles displayed in tModBase. Each row represents a condition: (A) different tissues of mouse and (B) the presence or absence of microorganisms, and each column represents a site on the tRNA molecule. The colour indicates the strength of the misincorporation signal, such as the percentage of mismatches.

