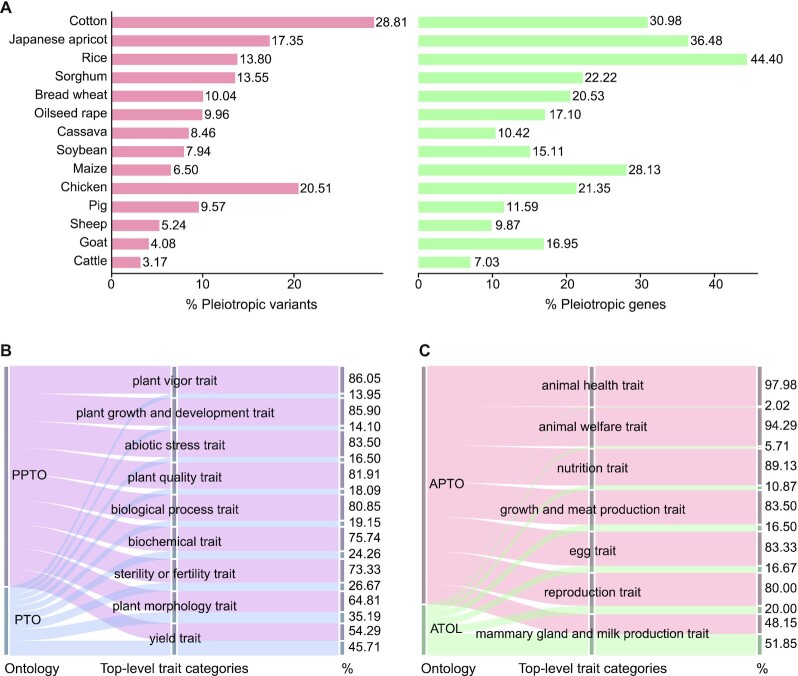
Figure 3.
Data statistics of pleiotropic variants and genes and distribution of trait terms in several reference ontologies. (A) The proportion of pleiotropic variants and genes in 14 species (9 plants and 5 animals). (B) The proportion of PPTO and PTO ontology terms in each top-level trait category. (C) The proportion of APTO and ATOL ontology terms in each top-level trait category.

