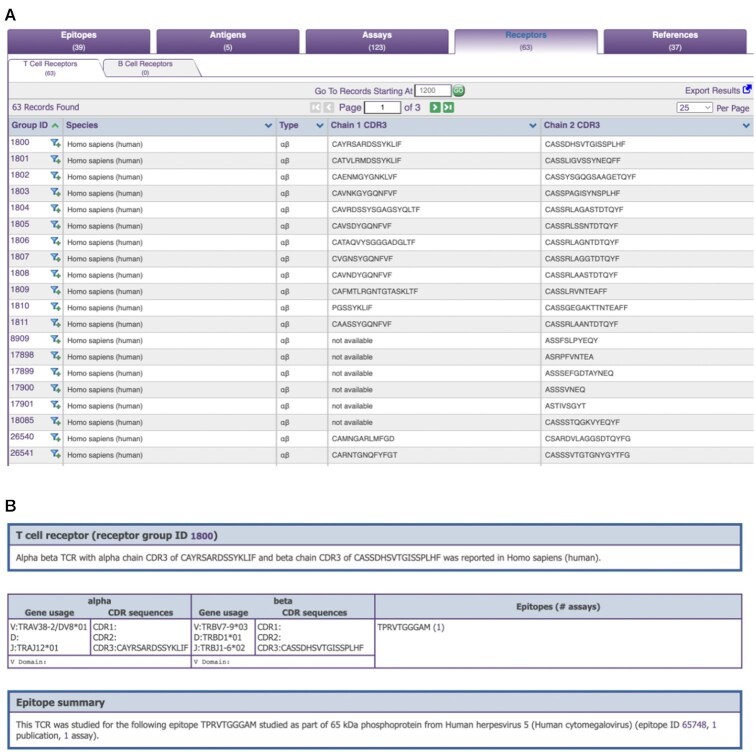
Figure 4.
CEDAR results presentation of receptor data. (A) The ‘Receptor’ tab has two sub-tabs for T cell and B cell receptors. In each row of the TCR or BCR tab, a unique receptor is displayed along with the species it was reported in, the type, and the Chain 1 and Chain 2 CDR3 sequences, if available. (B) The ‘Receptor Details’ page provides relevant information about the species that the receptor was reported in and links to the 3D structures in PDB. In the data table below, the gene usage and sequences for CDR1, CDR2 and CDR3, as well as the full-length receptor sequence are displayed if available for both alpha and beta chains. Sequences of the epitopes that the receptor was reported to recognize are also listed, together with links to the corresponding epitopes in CEDAR.

