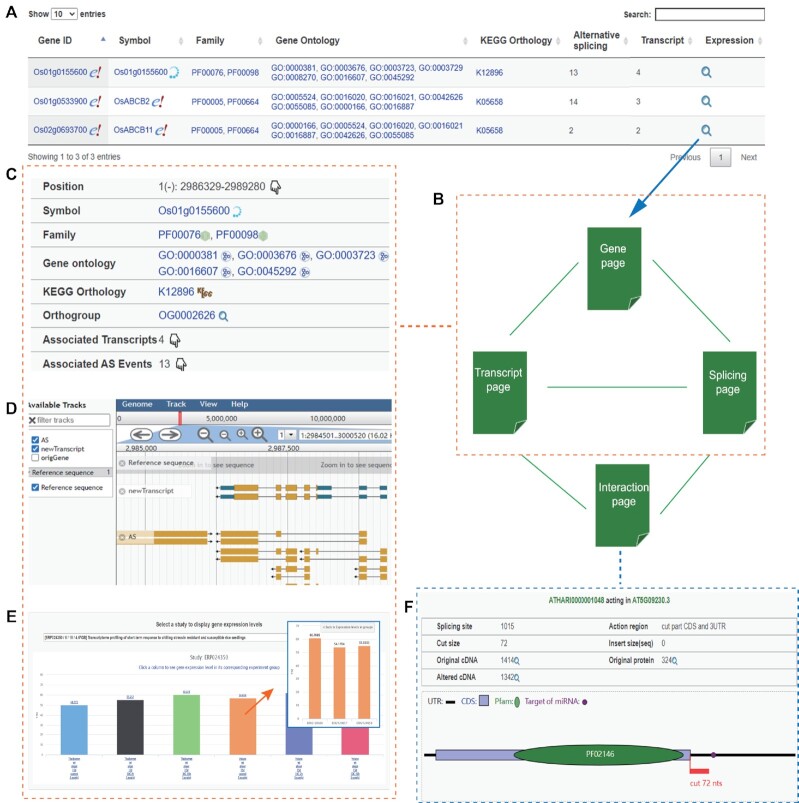
Figure 2.
Database retrieval and result visualization. (A) The retrieved genes by terms or sequence are listed in an interactive table with links for users to open the gene page showing expression data. (B) The gene, transcript, splicing and interaction pages are interconnected by the inner links in pages. The gene, transcript and splicing page have similar layout, including basic annotation information (C), visualized genomic context (D) and expression/splicing profiles (E). (F) The visual effect of an alternative splicing event on a transcript is shown in the interaction page. The alternative splicing removes 72nts from the transcript.

