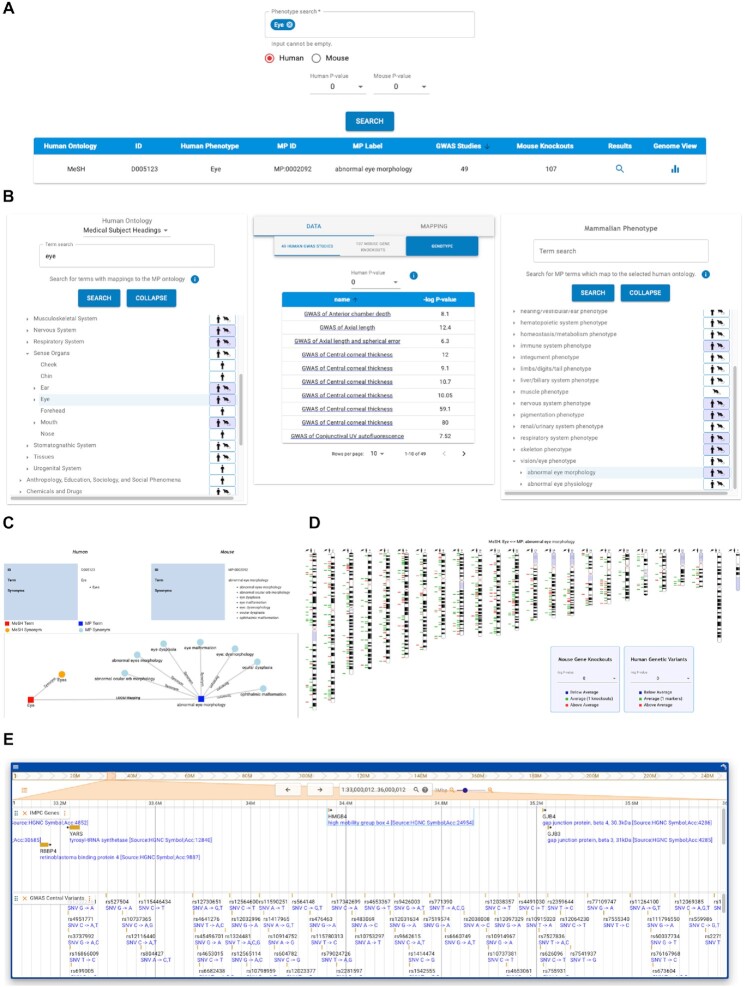
Figure 3.
Interfaces for exploring integrated GWAS and mouse gene data. (A) The results from the text search displays term mappings and the number of GWAS studies and mouse gene knockouts matching the query term(s). (B) The ontology hierarchy comparison interface displays which terms are associated with human and mouse data sets. A search using one ontology will retrieve records annotated to the mapped term. In this example, a MeSH GWAS search for ‘eye’ phenotypes also retrieves mouse genes annotated to ‘abnormal eye morphology’. (C) The ontology mapping graphic presents the source of the term mapping. (D) The heatmap alongside each chromosome indicates the number of mouse genes (first column) and GWAS markers (second column) per 3 Mb bin having a P-value that passes a tunable significance threshold. (E) A dynamic region-level browser, where scale and position may be tailored to one's preferences, presents optional tracks for individual GWAS marker associations and IMPC mouse genes.

