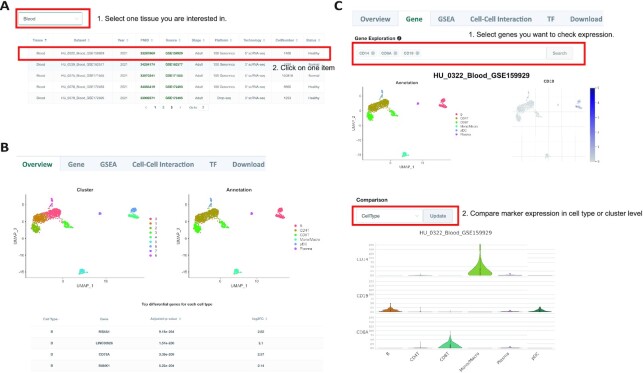
Figure 3.
Expression visualization of a single dataset in HUSCH. (A) Datasets table of the blood tissue. Users could click on a certain dataset and enter the single dataset exploration page. (B) The overview tab of the HU_0322_Blood_GSE159929 dataset. Two UMAP plots with cells colored by cluster ID (left) and cell type (right) are displayed at the top of the tab. The bottom table below shows DE genes in each cell type cluster. (C) The gene tab of the single dataset exploration page. The expression of genes of interest can be visualized at single-cell and cell type resolution. The upper figures showed the expression visualization in single-cell resolution by UMAP, and the bottom violin plot visualizes the expression at the cell type level.

