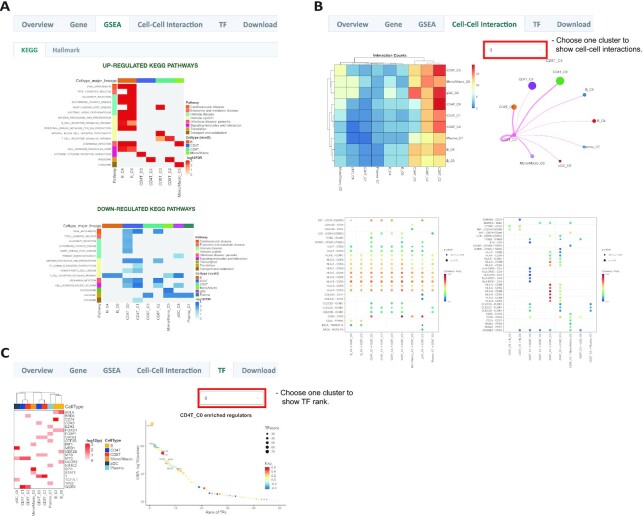
Figure 4.
Advanced analyses of a single dataset in HUSCH. (A) GSEA results of a single dataset. The enriched up- or down-regulated hallmark pathways in each cluster are visualized in heatmaps. (B) CCI results of a single dataset. The left top heatmap displays the number of interactions between different cell types, the right top circle plot displays the number of interactions between a certain cell type and other cell types. The bottom dot plot displays significant CCIs (P-value < 0.01) of selected cell types. Left, the selected cell type as receiver cells, right, the selected cell type as sender cells. (C) The left one is heatmap of significant enriched transcriptional regulators predicted by LISA for each cell type cluster, the right one is dotplot of the rank for regulators predicted in cluster CD4T_C0.

