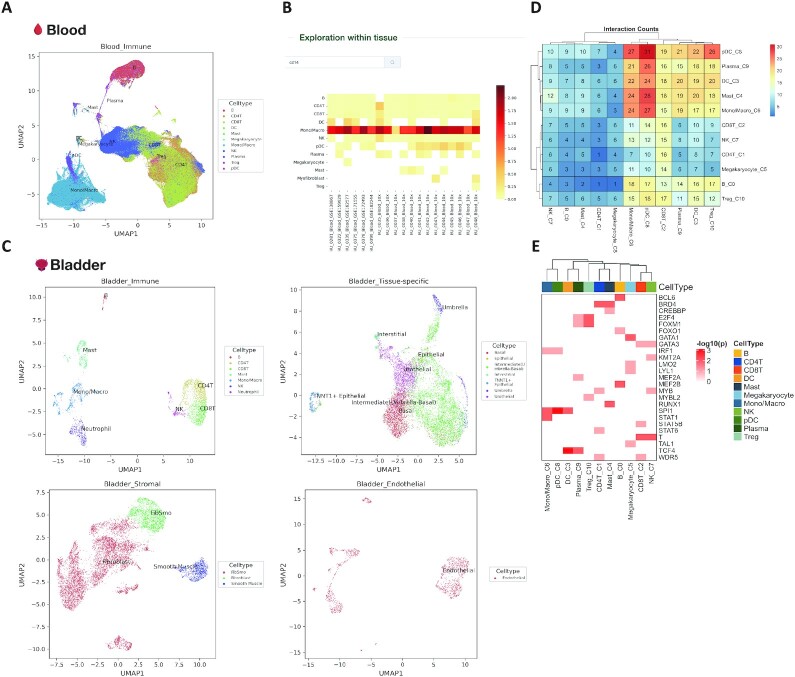
Figure 5.
Tissue level expression visualization in HUSCH. (A) The cell type annotation of integrated blood tissue. (B) Heatmap showing the expression of CD14 across different blood datasets in HUSCH. The color indicates the expression level of the gene. (C) The cell type annotation of integrated bladder tissue, the UMAP was plotted for four major lineages, including tissue-specific, immune, endothelial and stromal. (D) Heatmap summarizing the number of significant CCIs between different cell type clusters. (E) Heatmap of significant enriched transcriptional regulators predicted by LISA for each cell type cluster.

