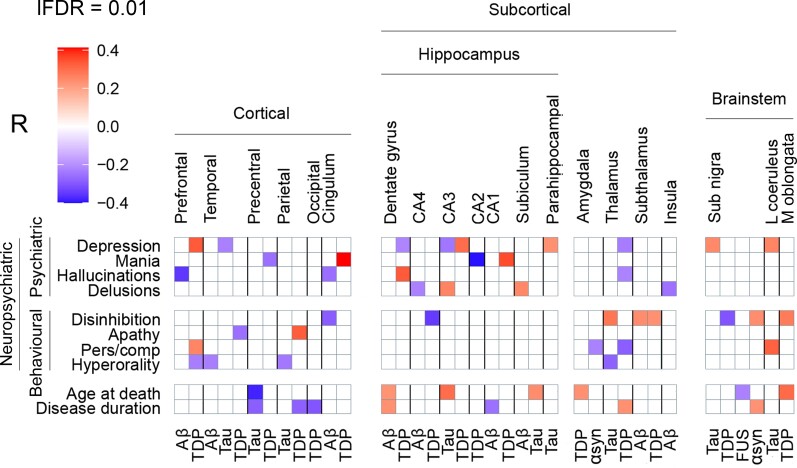
Figure 2.
Whole-brain clinicopathological partial correlations between neuropsychiatric symptoms and regional pathology burden. Neuropsychiatric symptoms are shown on the left, brain regions are shown at the top, and pathological proteins are shown on the bottom. Partial correlation coefficients are represented with a colour gradient (top left). Red boxes represent positive correlations, purple boxes represent negative correlations. All correlations are significant at the 0.01 level. lFDR = local FDR threshold; sub nigra = substantia nigra; l coeruleus = locus coeruleus; m oblongata = medulla oblongata; pers/comp = perseverative/compulsive.

