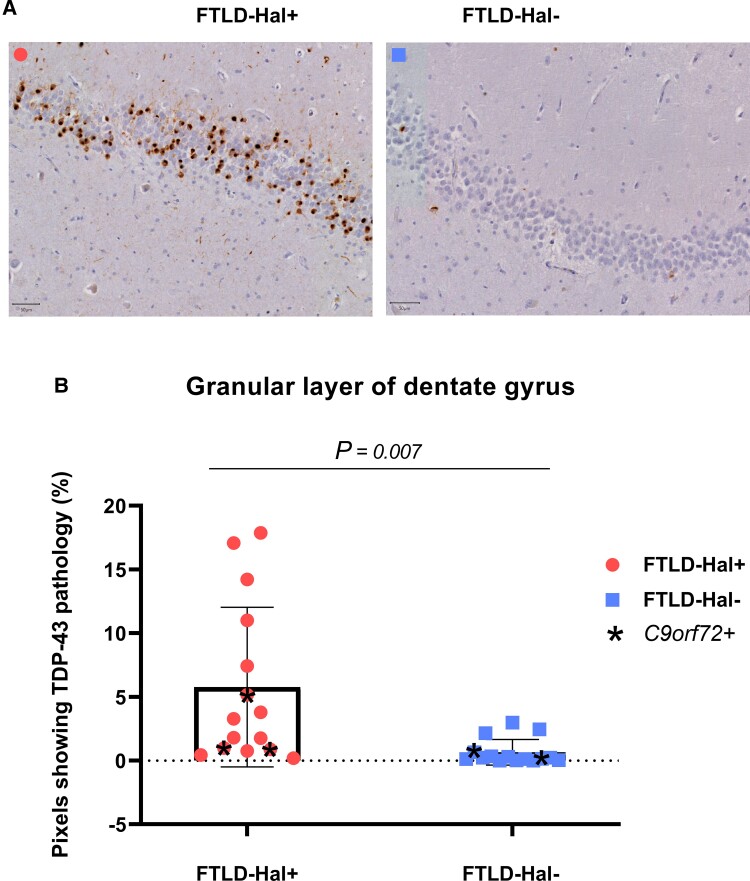
Figure 3.
Quantification of TDP-43 burden in the granular layer of the hippocampal dentate gyrus. (A) TDP-43 stained sections of the middle hippocampus from two FTLD donors, one from the FTLD-Hal+ group (left) and one from the FTLD-Hal− group (right). Scale bar = 50 µm. (B) Differential distribution of TDP-43 pathology burden—measured with ImageJ software as the percentage of pixels showing TDP-43 pathology—between FTLD-Hal+ and FTLD Hal− brain donors.

