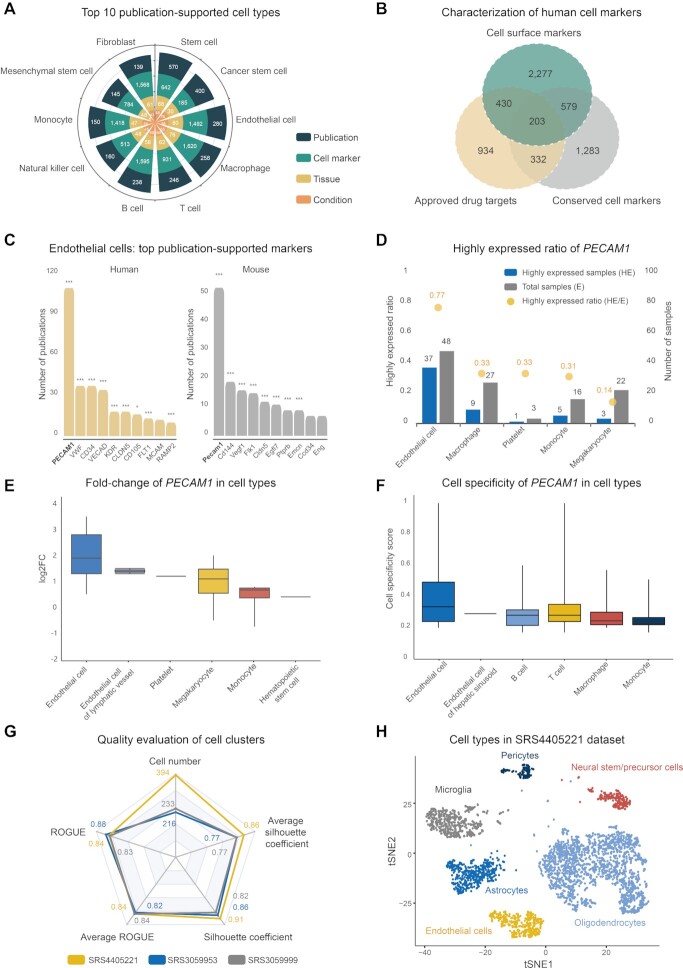
Figure 2.
Statistics of Cell Taxonomy and assessment of cell markers and cell clusters. (A) Top 10 publication-supported cell types as well as their statistics in terms of cell markers, tissues, conditions and publications. (B) Characterization of cell markers in aspect of cell surface markers, approved drug targets and conservation across species. (C) Top 10 publication-supported cell markers of endothelial cells in human and mouse. Statistical significance levels by p-values are calculated by the Fisher’s exact test with FDR correction (BH) and coded by: *** for < 0.001, ** for [0.001, 0.01) and * for [0.01, 0.05) (https://ngdc.cncb.ac.cn/celltaxonomy/celltype/CT:00000153#cell_marker/). (D) Highly expressed ratio of PECAM1 in human cell types (https://ngdc.cncb.ac.cn/celltaxonomy/celltype/CT:00000153#cell_marker_expression_enrichment/). (E) The distribution of expression fold-change of PECAM1 in various human cell types across samples. (F) Cell specificity score of PECAM1 in various human cell types across samples. (G) Quality evaluation of cell clusters for endothelial cells based on silhouette coefficient, ROGUE purity score and their averaged estimates as well as cell number. (H) t-SNE graph of cell types in SRS4405221 (https://ngdc.cncb.ac.cn/celltaxonomy/study/31270459#dimensional_reduction/).

