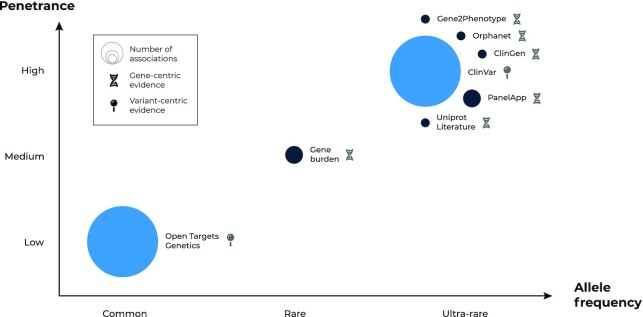
Figure 3.
Schematic representation of germline genetic evidence in the Platform. Data sources—bubbles—are classified based on the predominant allelic frequency and penetrance of the reported genetic variation. The size of the bubbles represents the number of target–disease associations provided by each data source sorted into three bins: 1) 1000–10 000—from 1966 (ClinGen) to 8506 (Orphanet); 2) 10 000–100 000—with 27 162 target–disease associations from Gene Burden analyses to 40 446 from PanelApp; 3) and 100 000 + associations (Open Targets Genetics: 694 214; ClinVar: 1 541 903). Data sources are classified depending on whether they capture genetic variation at the variant (lighter blue) or gene level (dark blue).

