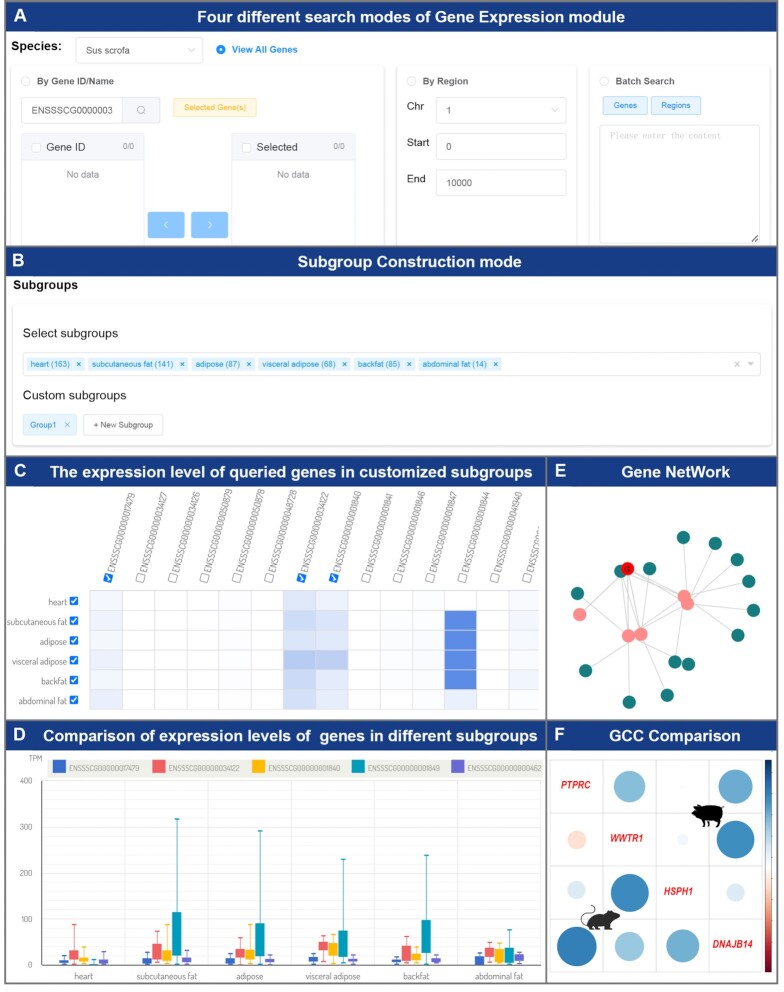
Figure 4.
The main functions and usage of the Transcriptome section. (A) There are four different search modes in the Gene Expression module. Users can select an appropriate mode to search the gene sets of interest. (B) There are two methods of constructing subgroups. Users can construct subgroups through tissue information or sample IDs. (C) The expression levels of queried genes in customized subgroups. Users can view the expression levels of genes in different subgroups conveniently. (D) Comparison of expression levels of specified genes in different subgroups. Users can select genes and subgroups of interest from a heatmap to be displayed in a boxplot for comparison. (E) The regulatory network of the specified gene and other genes. Users can obtain and visualize the gene set associated with the specified gene through the gene ID and the GCC threshold. (F) Visualization of the regulation patterns among PTPRC, WWTR1, HSPH1 and DNAJB14 between pigs and mice by using the GCC Comparison module.

