
Figure 6.
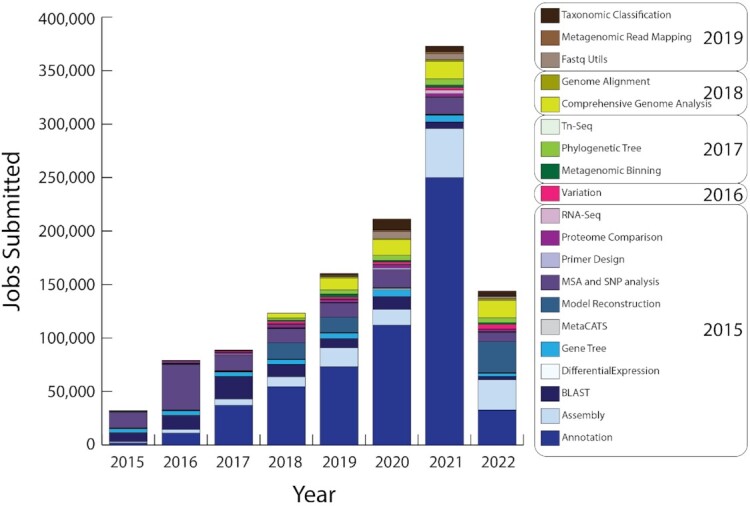
Growth in user jobs and services. The bar chart shows the growth in jobs per year starting with the PATRIC services in 2015. Boxes show the approximate year in which each service was either developed or integrated.
Official websites use .gov
A
.gov website belongs to an official
government organization in the United States.
Secure .gov websites use HTTPS
A lock (
) or https:// means you've safely
connected to the .gov website. Share sensitive
information only on official, secure websites.
Growth in user jobs and services. The bar chart shows the growth in jobs per year starting with the PATRIC services in 2015. Boxes show the approximate year in which each service was either developed or integrated.