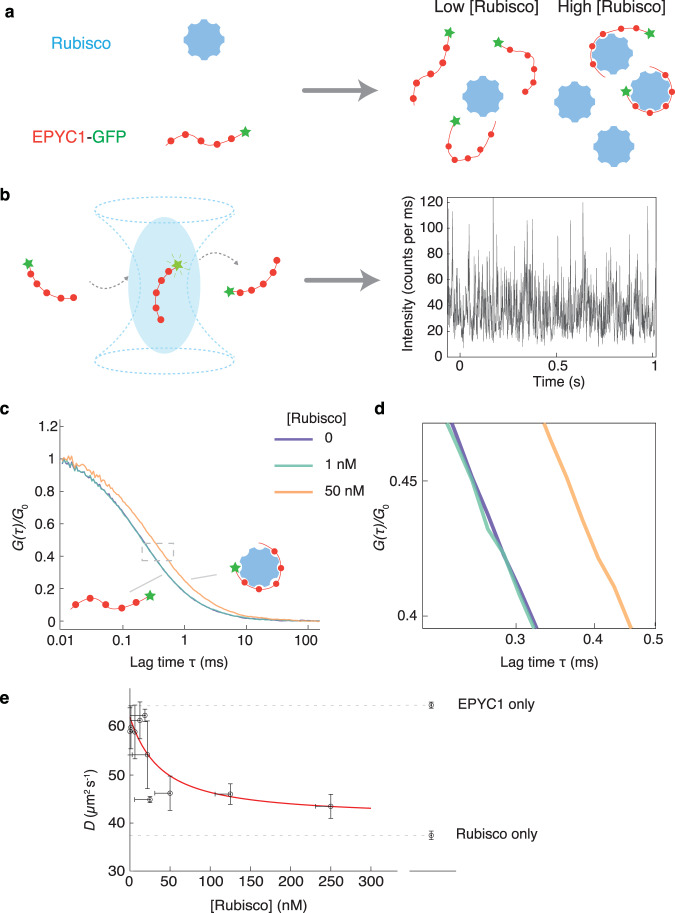
Fig. 2. EPYC1 and Rubisco form complexes when mixed at low concentrations in vitro.
a Cartoon illustrating how EPYC1 and Rubisco coexist at different concentrations in the one-phase region. b Schematic depiction of FCS and an example of an EPYC1-GFP fluorescence intensity time trace ([EPYC1-GFP] = 10 nM). c Fluorescence intensity autocorrelation curves of 10 nM EPYC1-GFP fluorescence at three different Rubisco concentrations. Each autocorrelation curve is normalized by its fitted G0 (e.g., correlation value at τ = 0, Methods). d An enlarged version of the region shown with dashed lines in c. e Diffusion coefficient (D) of EPYC1-GFP inferred from FCS as a function of Rubisco concentration. Vertical error bars are standard deviations of repeated experiments (n = 3). The horizontal error bars indicate the estimated uncertainty of the Rubisco concentration in the solution due to protein loss in the measurement chamber (Supplementary Note. 1). The red curve is a fit to a quadratic model (Supplementary Note. 2) with a Kd of ~30 nM. The diffusion rates for EPYC1-GFP-only and for Rubisco-Atto488-only are shown on the right. Concentrations are expressed in terms of Rubisco holoenzymes and EPYC1 proteins.

