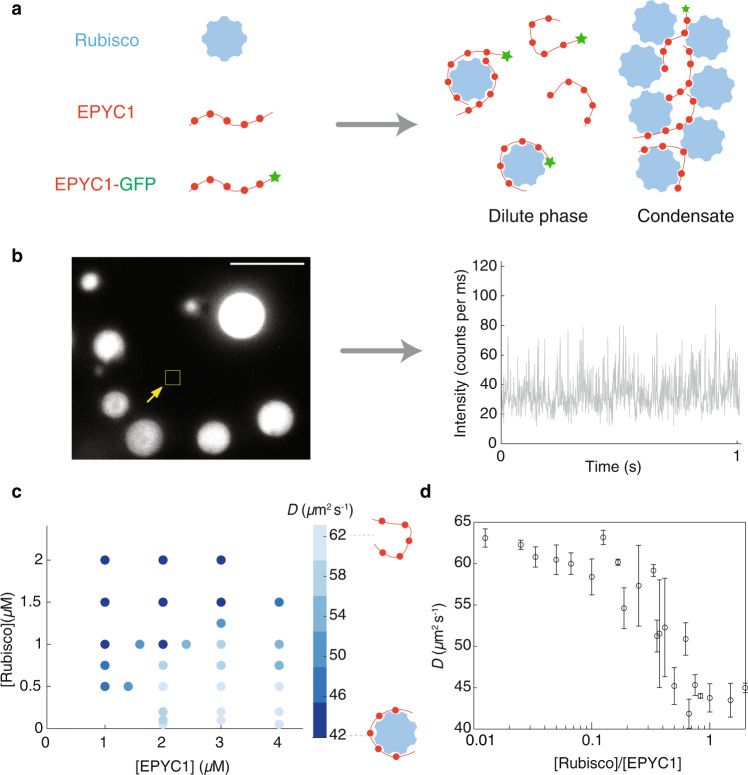
Fig. 3. EPYC1 and Rubisco form complexes in the dilute phase of a phase-separated system.
a Cartoon depicting EPYC1 and Rubisco complexes in the dilute phase alongside a condensate. b FCS was performed in a focal volume away from condensates to measure the diffusion rate of EPYC1-GFP in the dilute phase. The EPYC1-GFP concentration was fixed at 20 nM. Left image represents typical field of view (bulk concentrations: [EPYC1] = 4 μM, [Rubisco] = 0.75 μM), scale bar = 5 μm. Right image is a representative fluorescence intensity time trace in the dilute phase. c Diffusion coefficients (D) of EPYC1-GFP in the dilute phase in the presence of condensates obtained by FCS. Obtained D values are color coded as shades of blue (lighter blue represents higher D) and plotted on the phase diagram of Rubisco and EPYC1 concentrations. D values are the average values of 3 repeat experiments. d The diffusion coefficients (D) in c plotted against overall Rubisco/EPYC1 concentration ratio. Error bars are standard deviations of repeated experiments. Note that because the x-axis is the [Rubisco]/[EPYC1] ratio, in some cases different data points in c are clustered into one data point in d (for example, D values of 1 µM Rubisco with 2 µM EPYC1 and 0.5 µM Rubisco with 1 µM EPYC1 are summarized into one data point where the [Rubisco]/[EPYC1] ratio is 0.5). Concentrations are expressed in terms of Rubisco holoenzymes and EPYC1 proteins.

