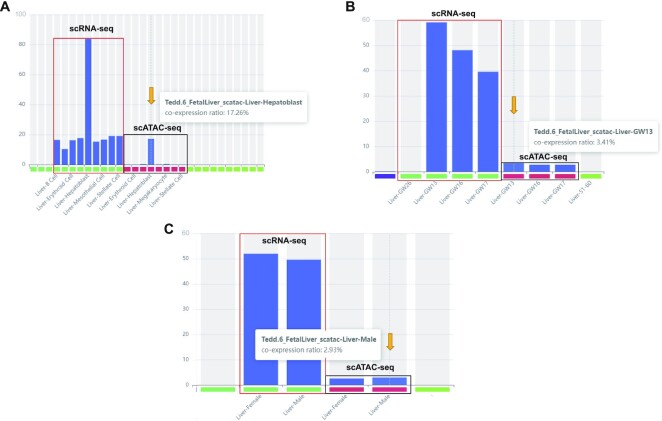
Figure 4.
Co-expression network. Temporal and cell-type specific co-expression with multiple genes exemplified by AFP and ALB genes. Identification of cells with co-expression of the targeted genes in cell-type (A), timepoint (B) and sexual categories (C). Each bar indicates the percentage of cells in each category with co-expression identified. In each figure, the column with the percentage of cells with co-expression of AFP and ALB gene identified shown is indicated by an orange arrow.

