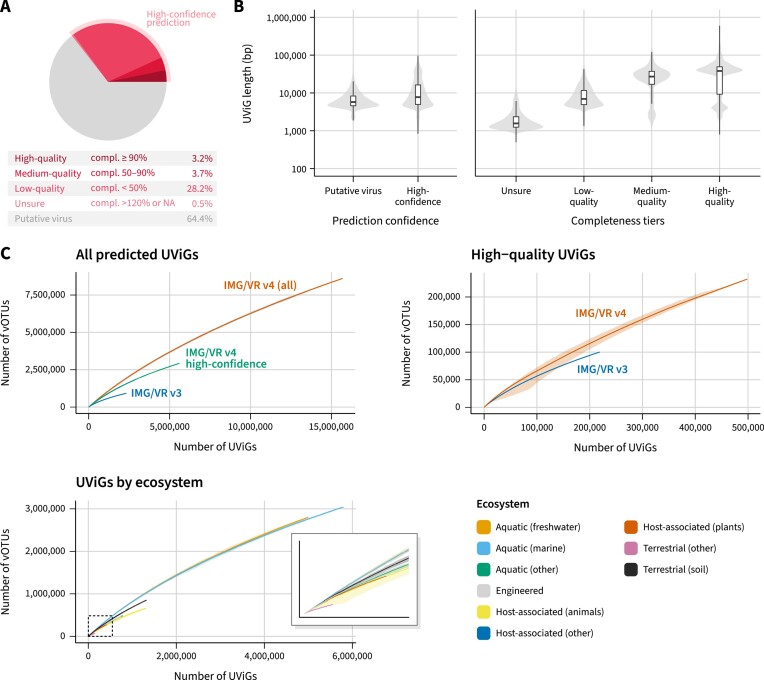
Figure 2.
(A) Fraction of high-confidence UViGs within IMG/VR v4 and the contribution of each of the completeness tiers. (B) Left: length distribution of UViGs classified as putative viruses and high-confidence viruses. Right: length distribution of the different completeness tiers within high-confidence predictions. (C) Accumulation curves of vOTUs across different subsets of IMG/VR. The top left panel shows the accumulation of vOTUs as a function of the number of UViGs for all sequences in IMG/VR v4, only high-confidence sequences, or for the sequences that were already present in IMG/VR v3. The top right panel shows similar accumulation curves considering only high-quality (i.e. high-confidence and ≥90% complete) UViGs. In this panel, for IMG/VR v3 high-quality UViGs, only sequences that were available through the IMG/VR v3 interface and are still available in the IMG/VR v4 database were included. Finally, the bottom panel shows similar accumulation curves separated by ecosystem and considering all sequences in IMG/VR v4. Each curve is the average of 50 random permutations, with the minimum and maximum value at each step indicated with a gray (top two panels) or colored (bottom panel) outline.

