
Figure 1.
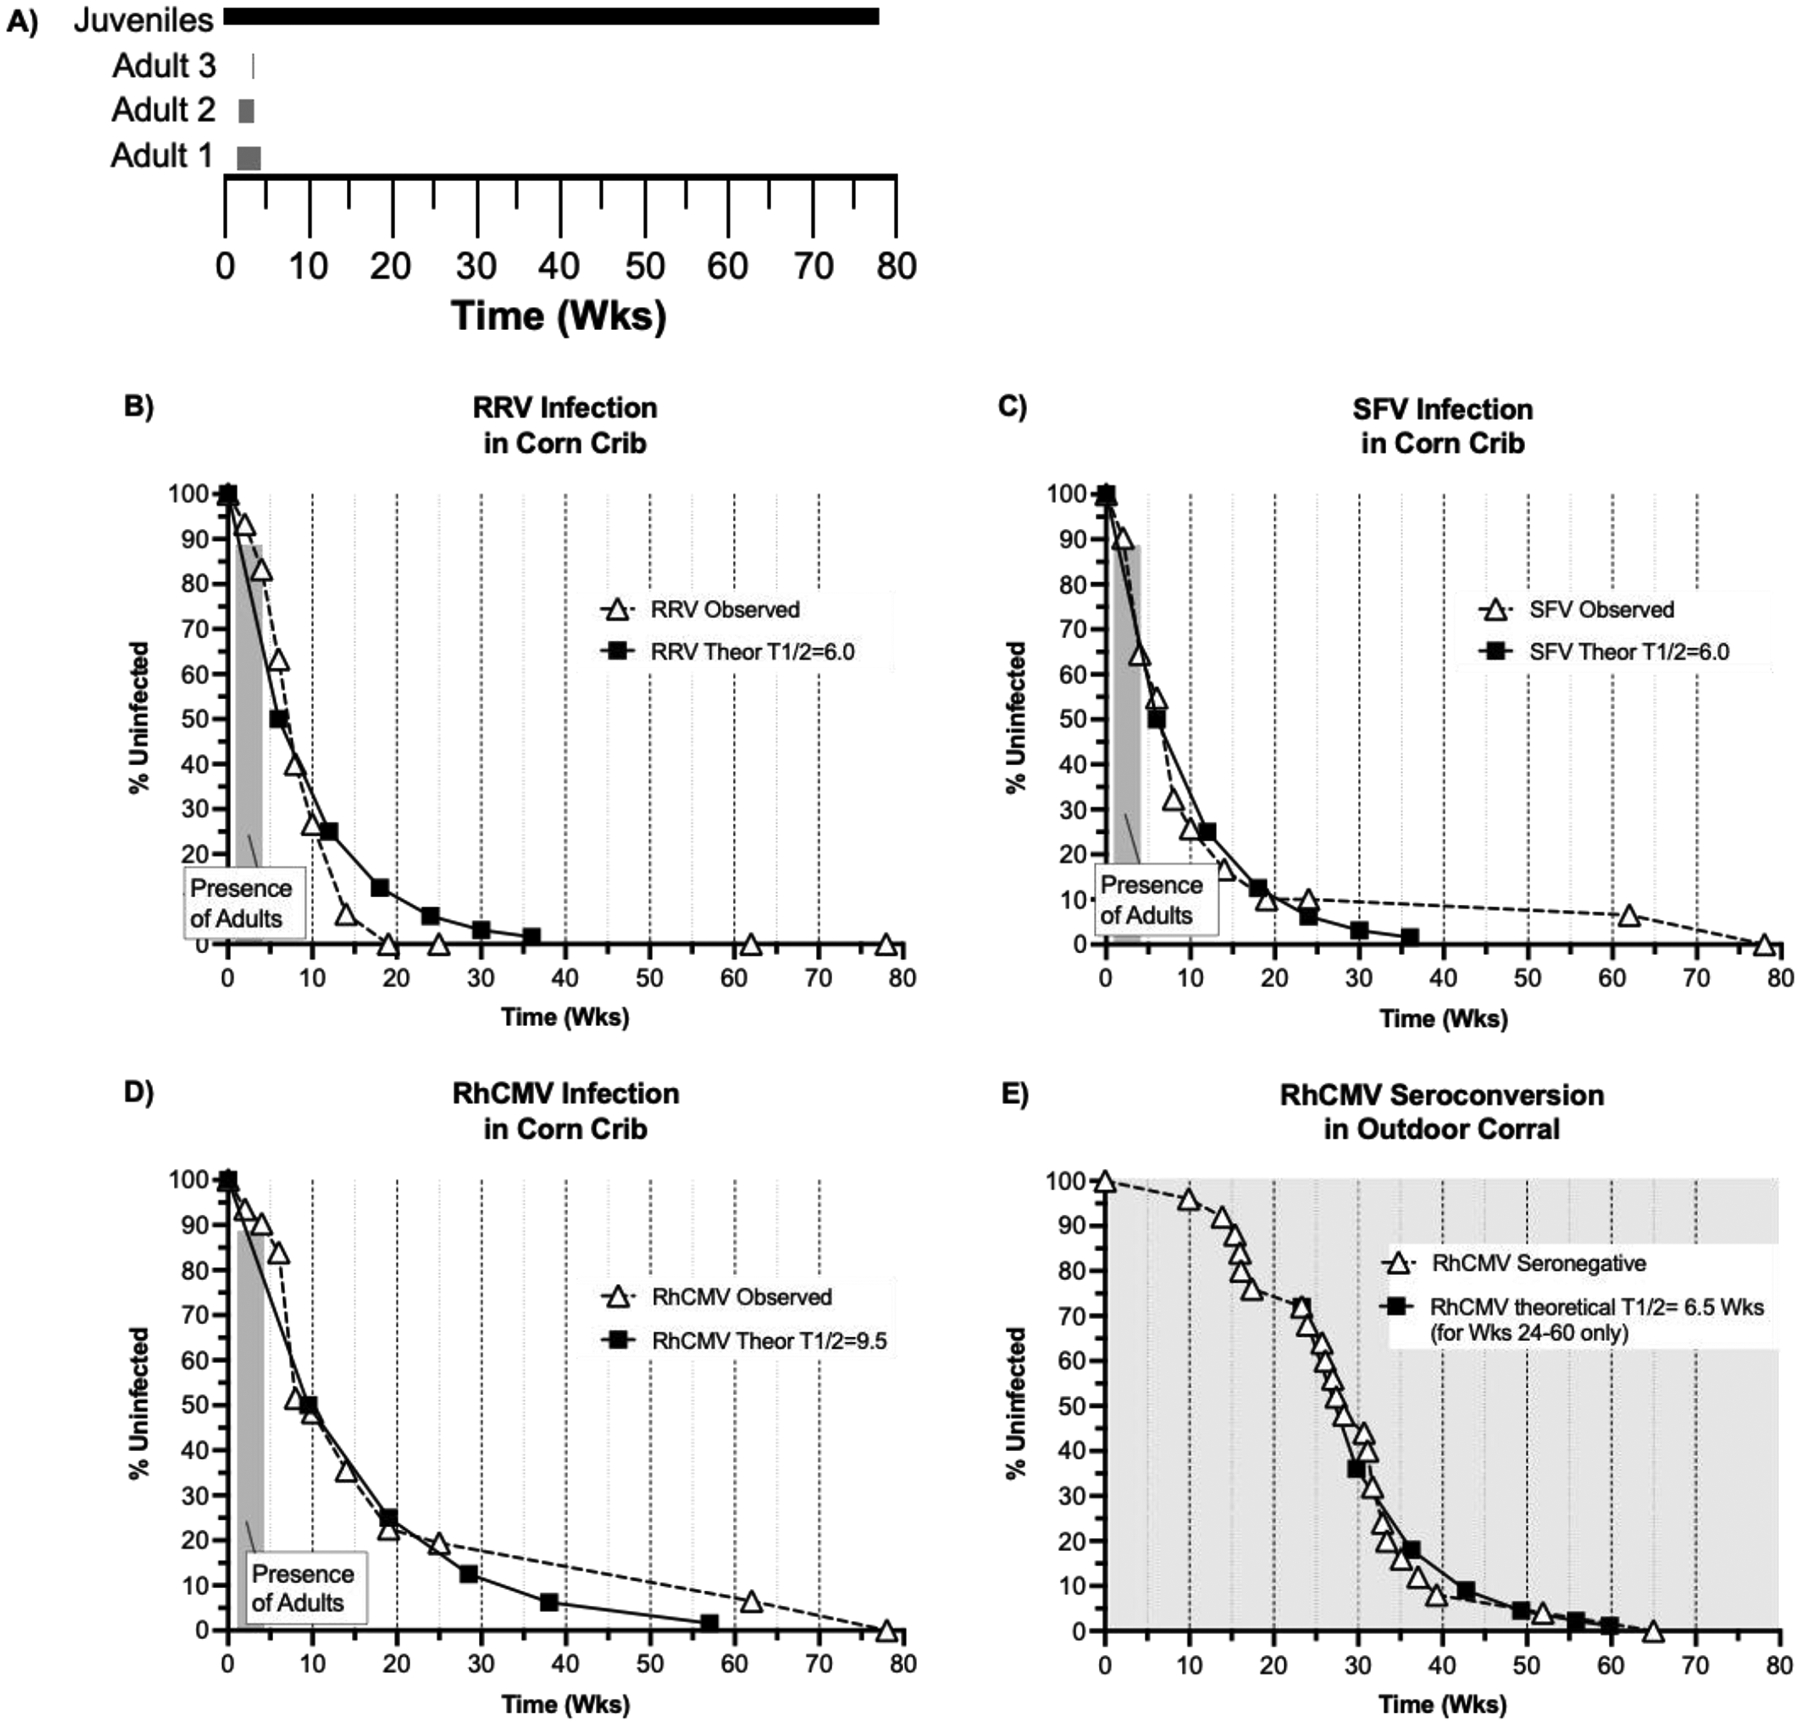
(A) Co-housing timeline (X-axis in Weeks-Wks) for the SPF2 juveniles (black box) and the 3 adults infected with RRV, SFV, and RhCMV (gray boxes). Infection rates for (B) RRV, (C) SFV, and (D) RhCMV in corn crib housing (dashed lines and triangles). The graphs plot the % uninfected frequency (Y-axis) versus time (in weeks, X-axis). The shaded box indicates the period of co-housing with virus-infected adults (Shown in part A). Theoretical infection curves (T1/2 = half-life of uninfected status) for each virus are plotted (solid line and squares). (E) The seroconversion rate for neonates born within an outdoor breeding corral are presented (adapted from a previous publication (33)). The T1/2 curve is only plotted from Wk 24 to Wk 60 (post weaning only). The shading indicates that neonates were continuously co-housed with RhCMV-infected animals after birth.