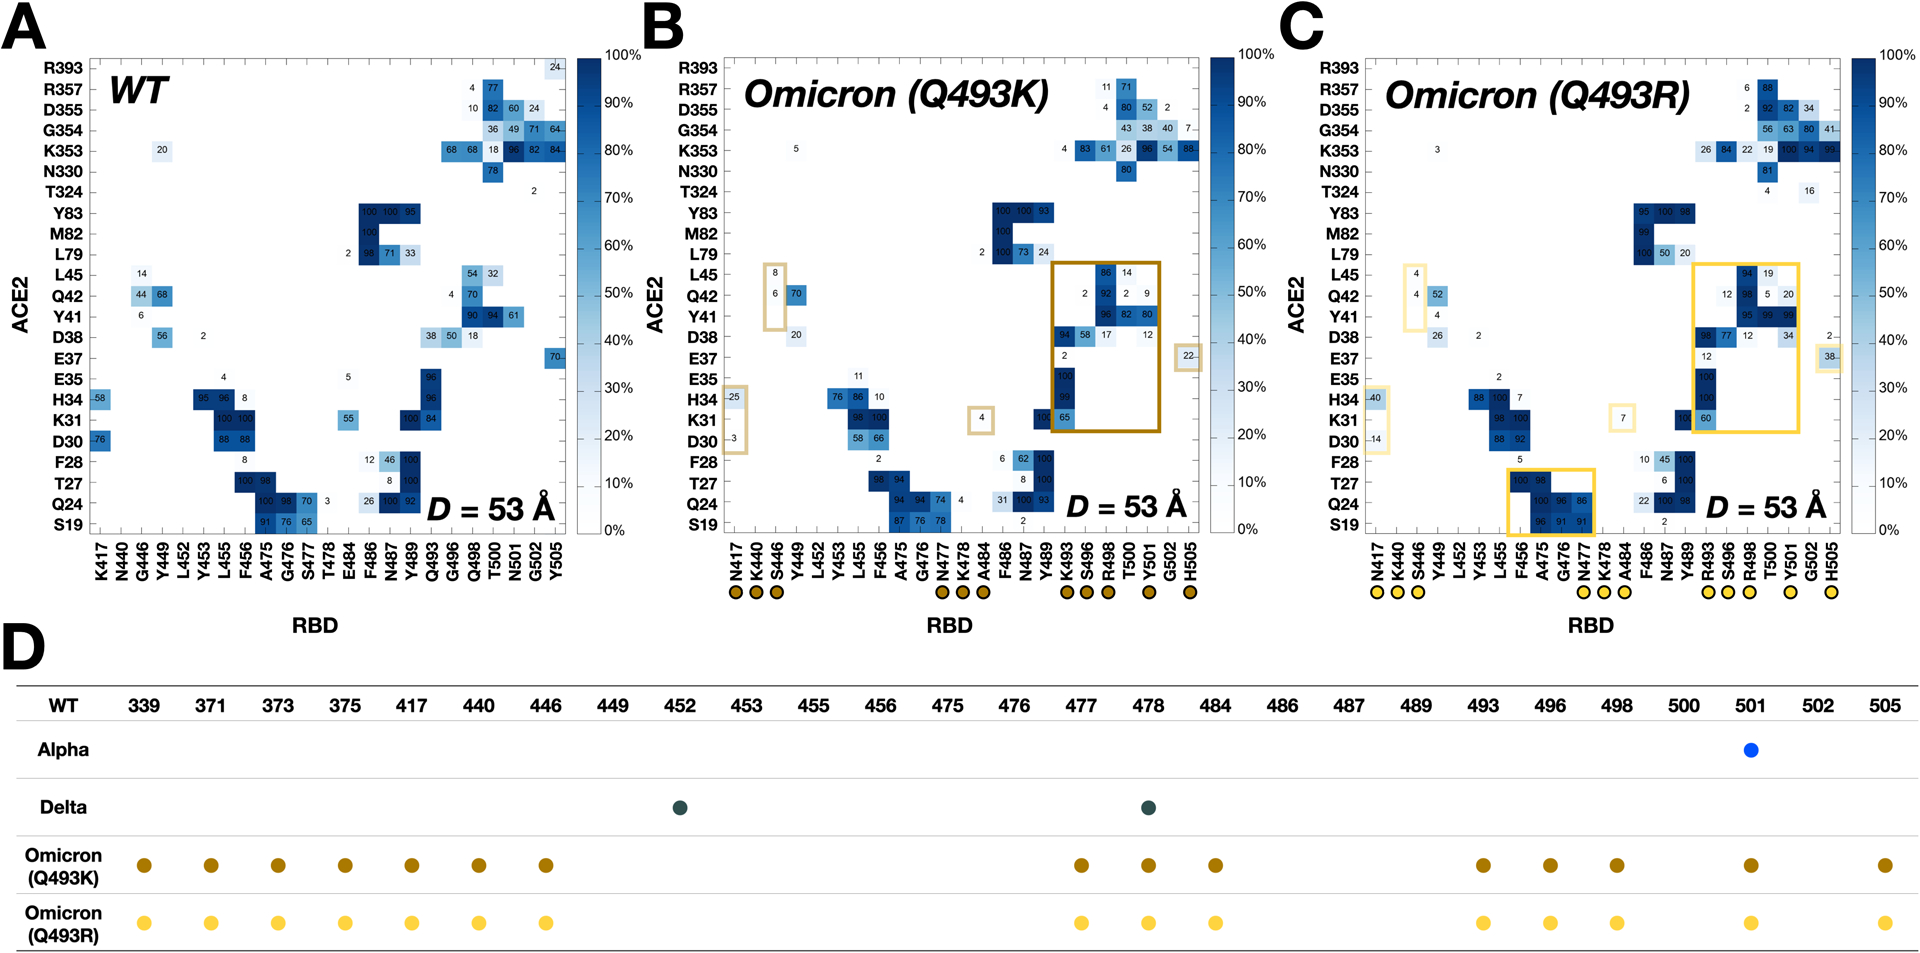
Figure 2.

Two-dimensional contact maps of residues in RBD-ACE2 interface at D = 53 Å. (A) Interacting residue pairs between RBDWT and ACE2. RBD residues subjected to mutation are marked with colored circles at the bottom: (B) brown for Omicron Q493K and (C) gold for Omicron Q493R. The contact frequency is displayed with colors from light blue to dark blue. Solid and transparent boxes on the map respectively represent increased and decreased interactions between RBD and ACE2 upon mutations. (D) A summary of RBD mutations in the Omicron variants.
