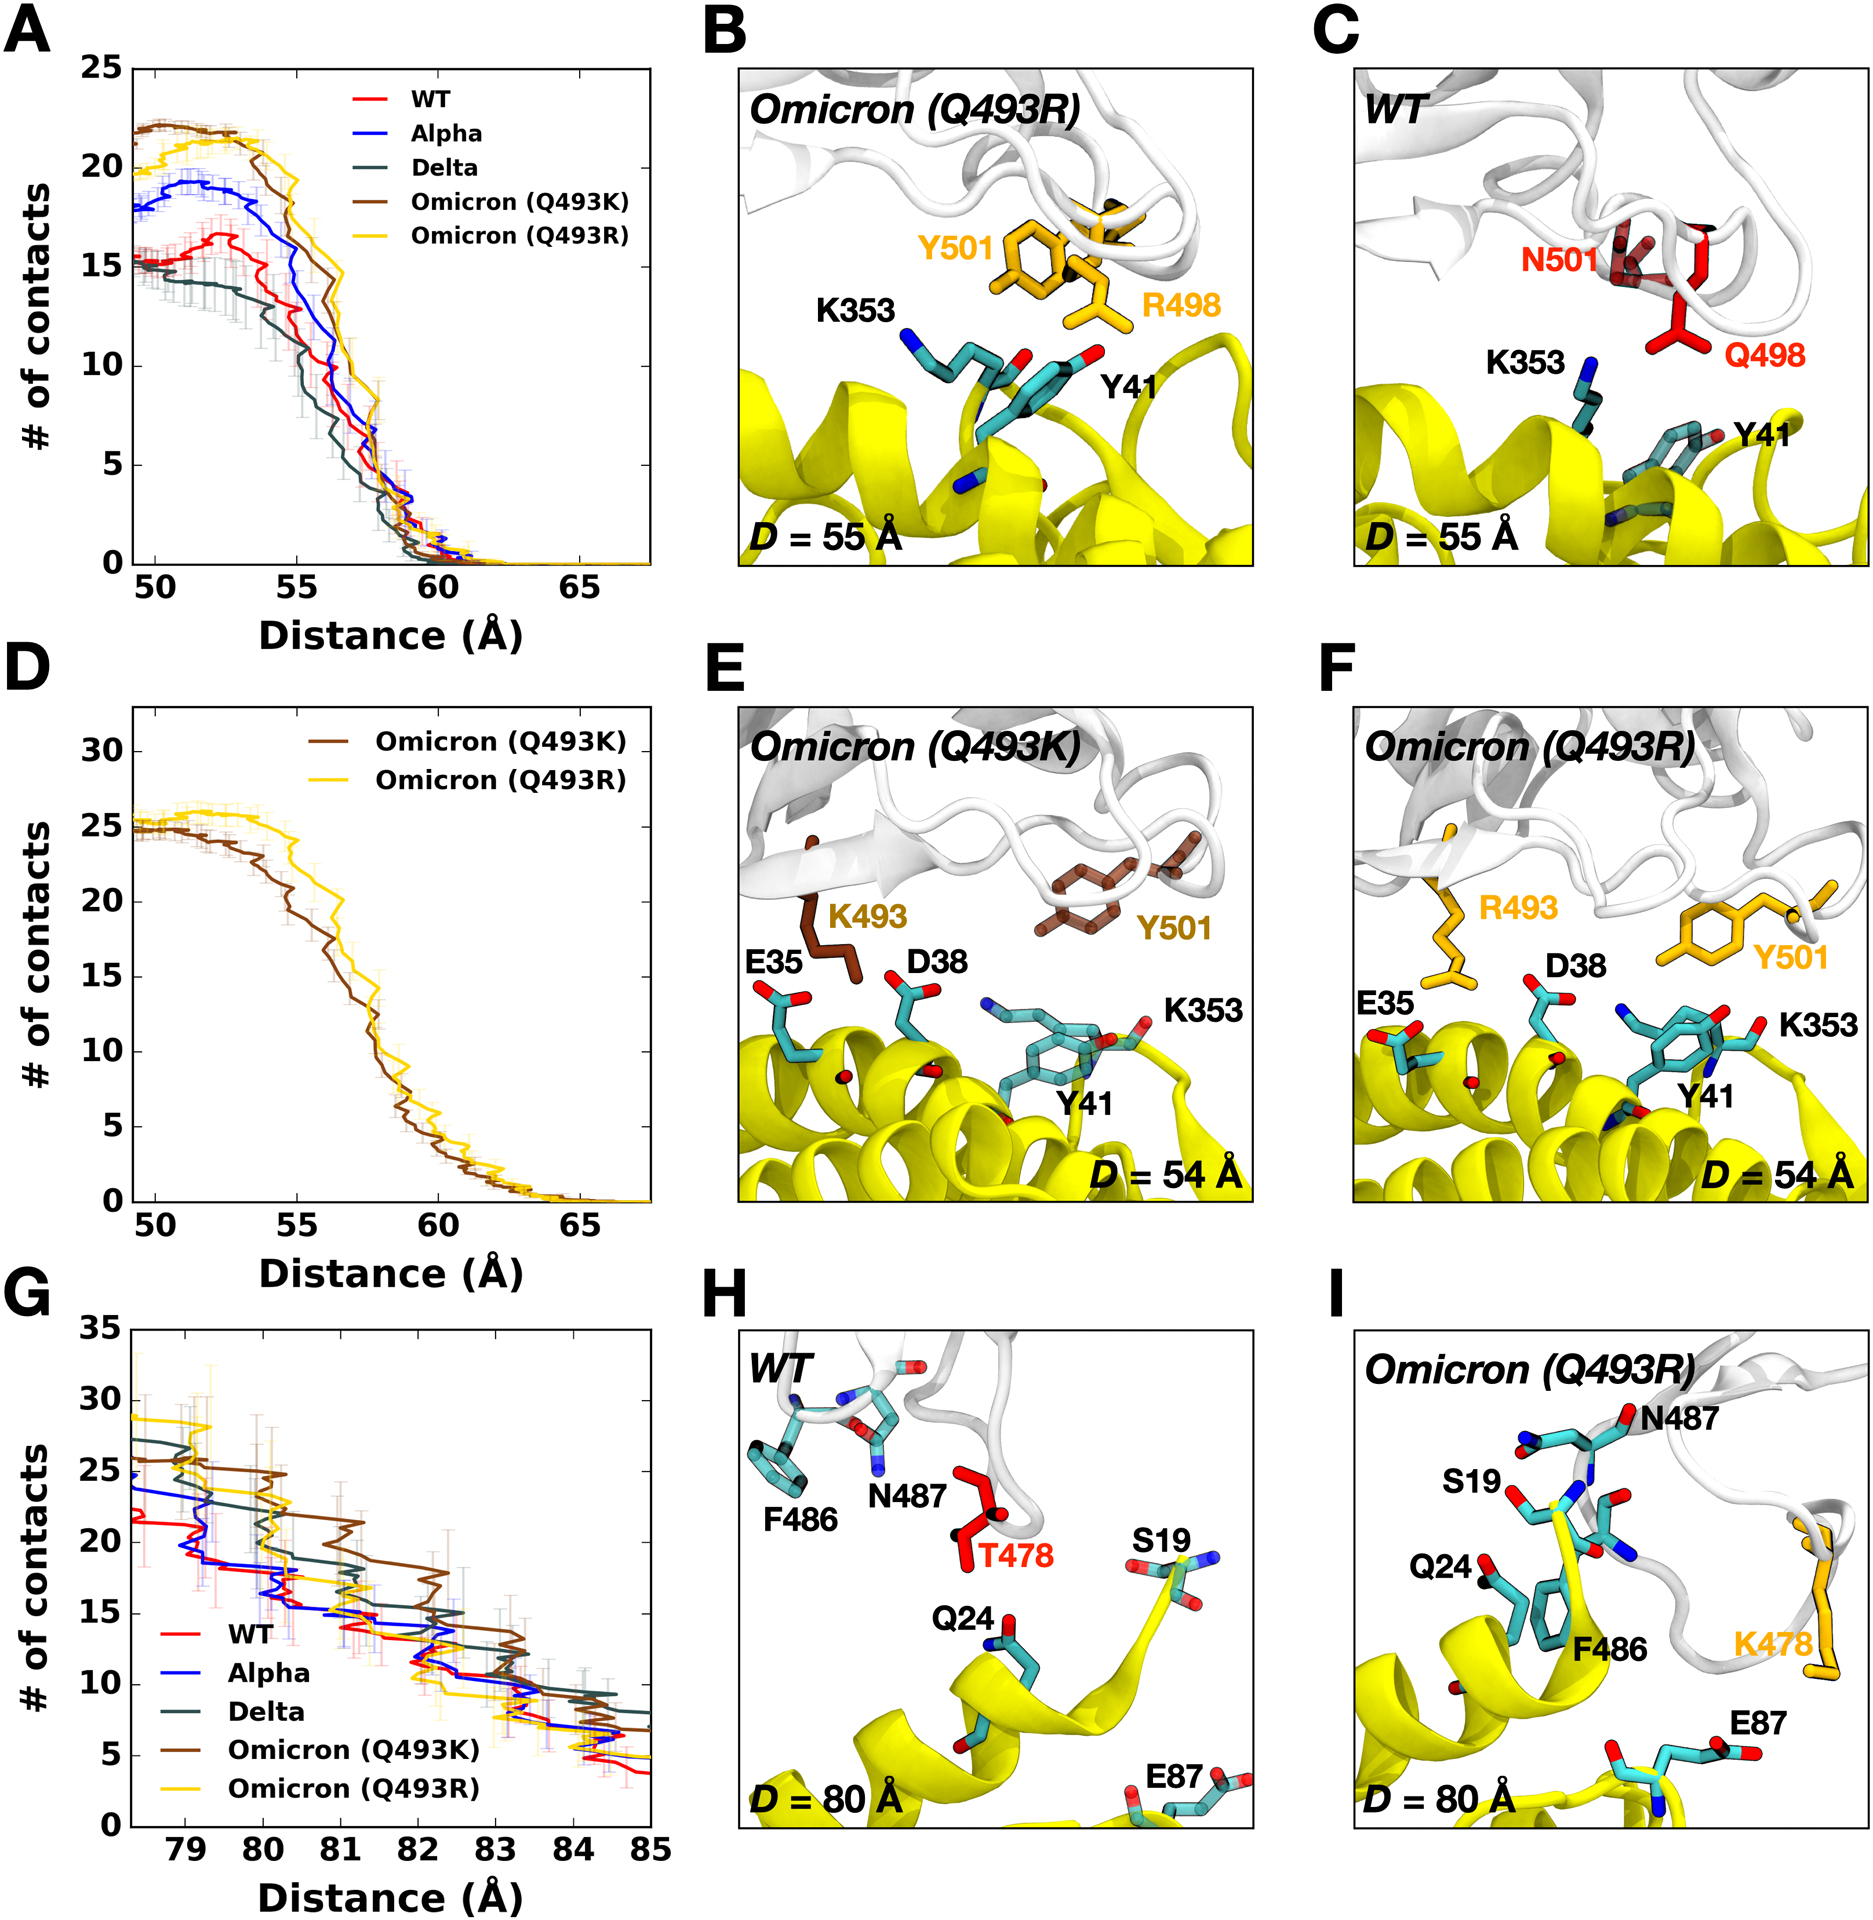
Figure 3.

(A) The average number of contacts between RBD residues 498 and 501 and ACE2. (B and C) Representative snapshots at D = 55 Å of (B) Omicron Q493R and (C) WT. (D) The average number of contacts of Omicron variants between residues in RBD and ACE2 and (E and F) their interacting snapshots of (E) Q493K and (F) Q493R at D = 53 Å. (G) The average number of contacts between RBD residues and ACE2 and (H and I) key interaction pairs at D = 80 Å of (H) WT and (I) Omicron Q493R. The overall color scheme is the same as in Figure 1 (i.e., red for WT, brown for Omicron Q493K, and gold for Omicron Q493R). Interacting residues are presented as solid sticks, and residues losing their interactions are depicted as transparent sticks.
