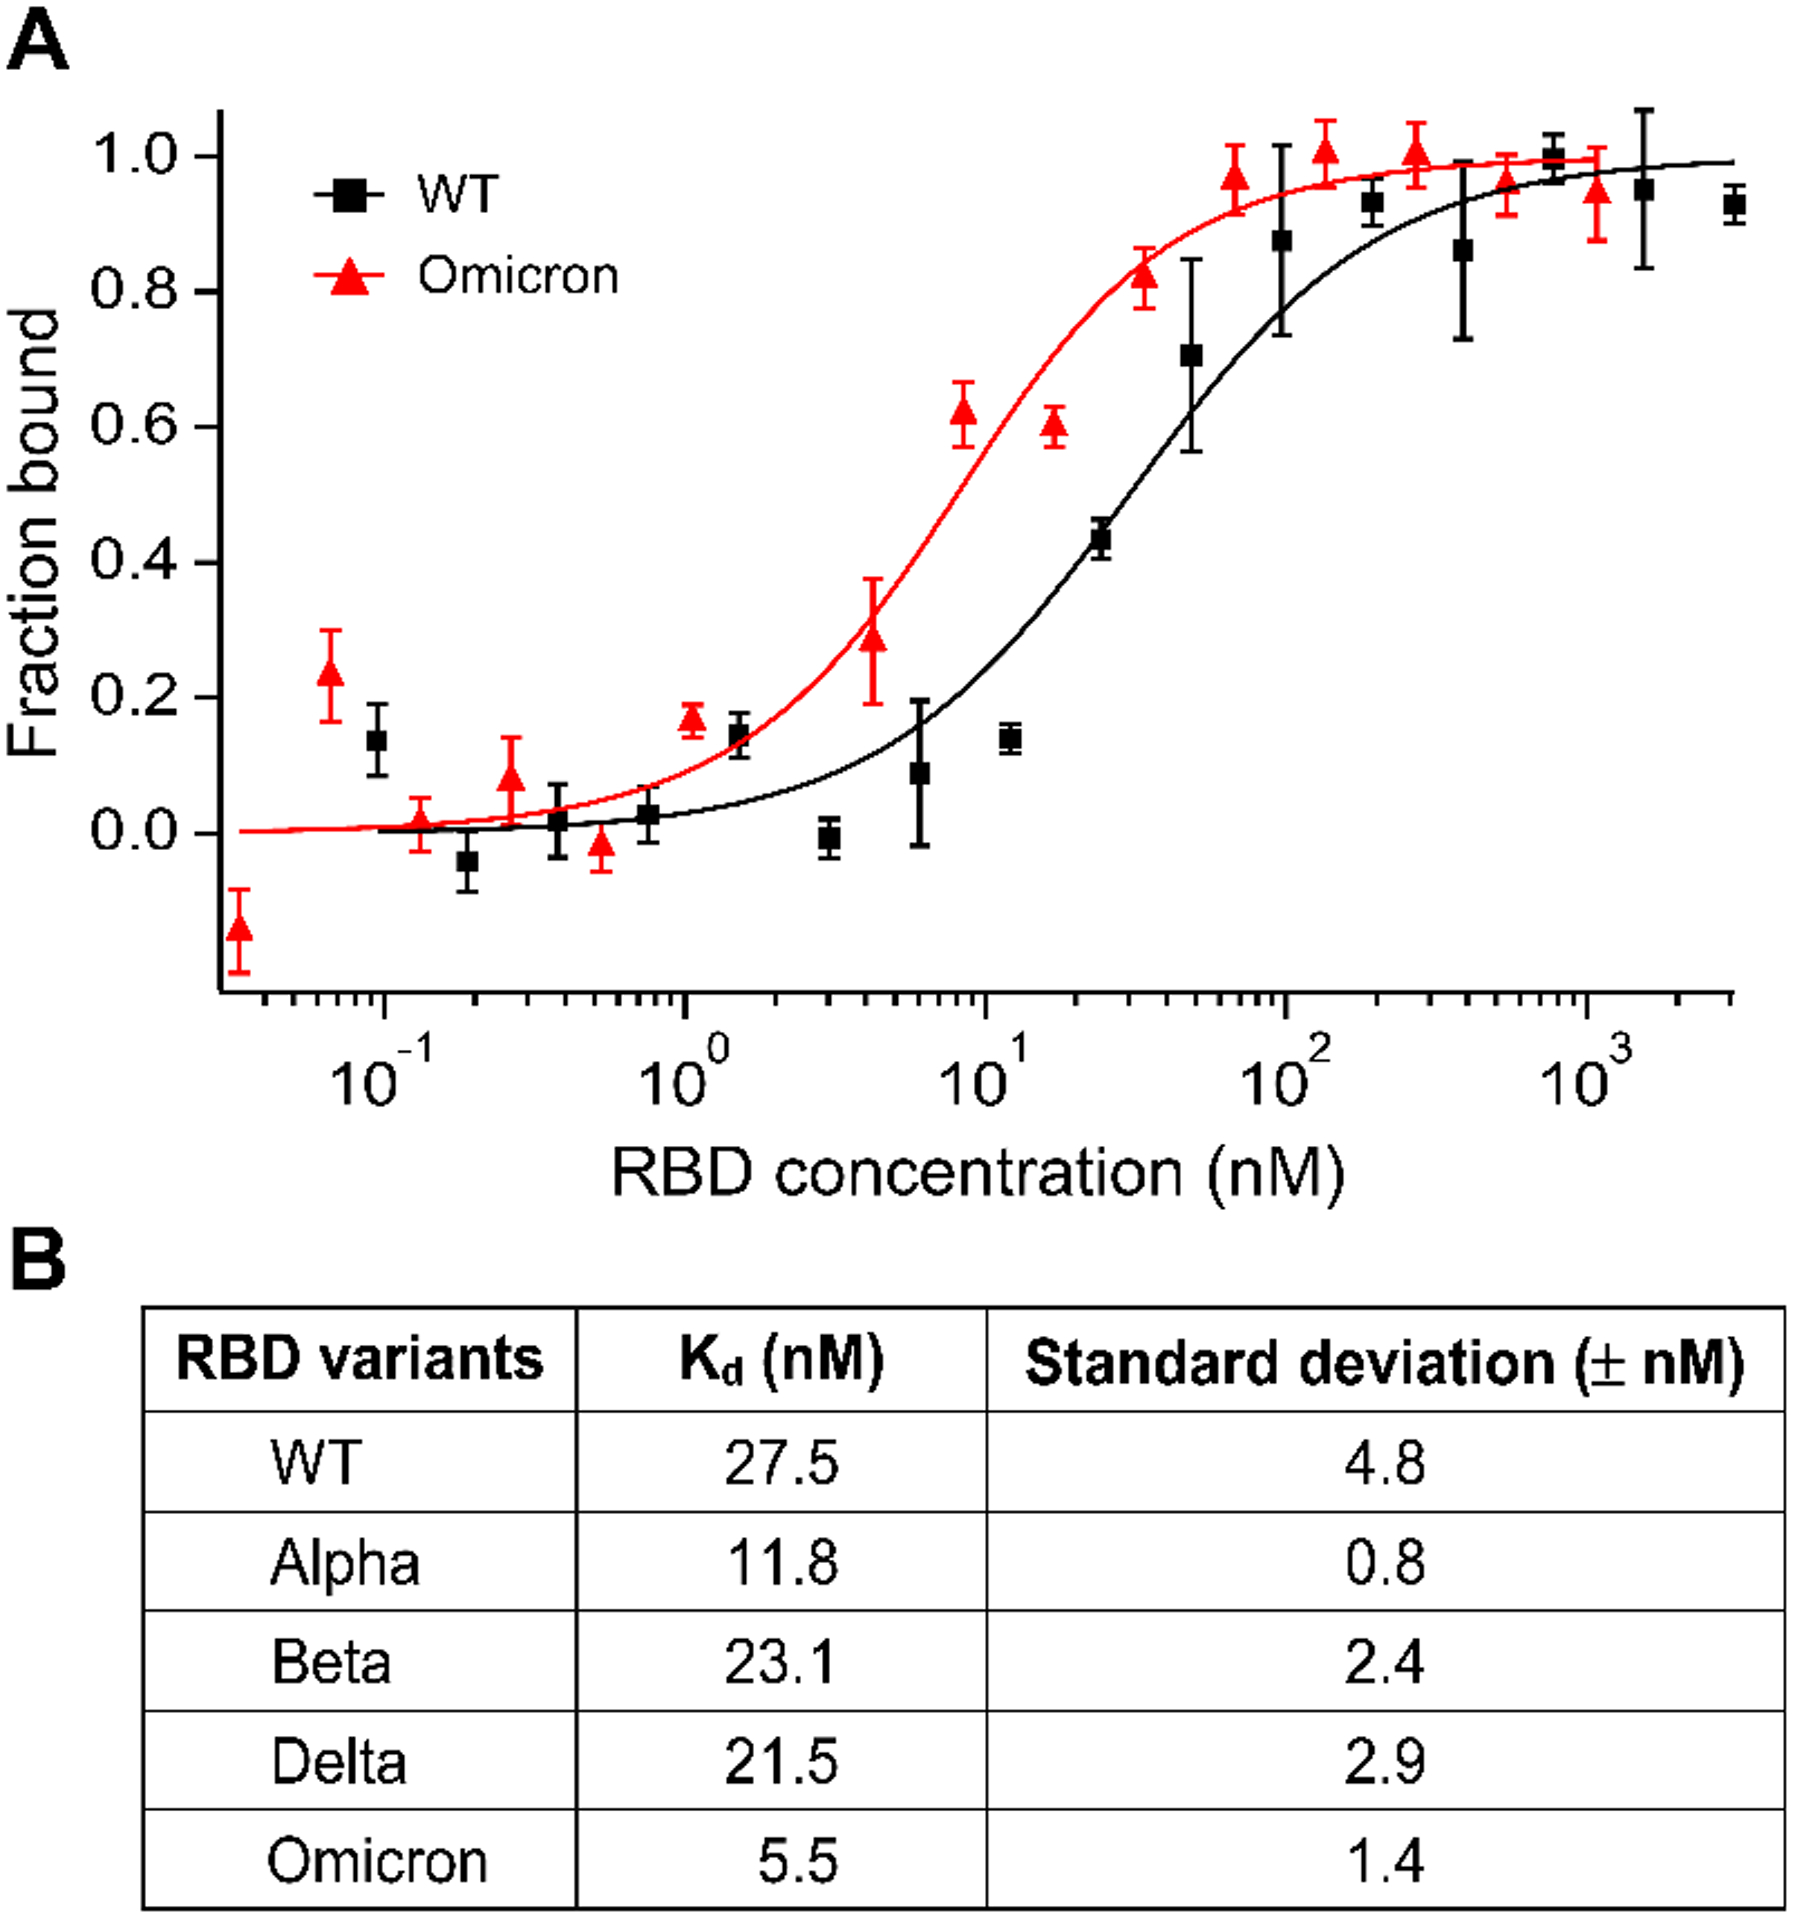
Figure 4.

(A) Microscale thermophoresis (MST) analysis of the interaction between ACE2 and RBD of the WT or Omicron variants. Error bars represent standard deviations from five individual repeat measurements. The binding affinities were determined by fitting the data with the ‘Kd’ model of the MO Affinity software. (B) Affinities of ACE2 binding to RBD variants detected by MST. The MST responses were fitted to the 1:1 binding model. The Kd rates are shown as fit ± one standard deviation. Data of the WT, Alpha, Beta, and Delta variants were adapted from our prior study.19
