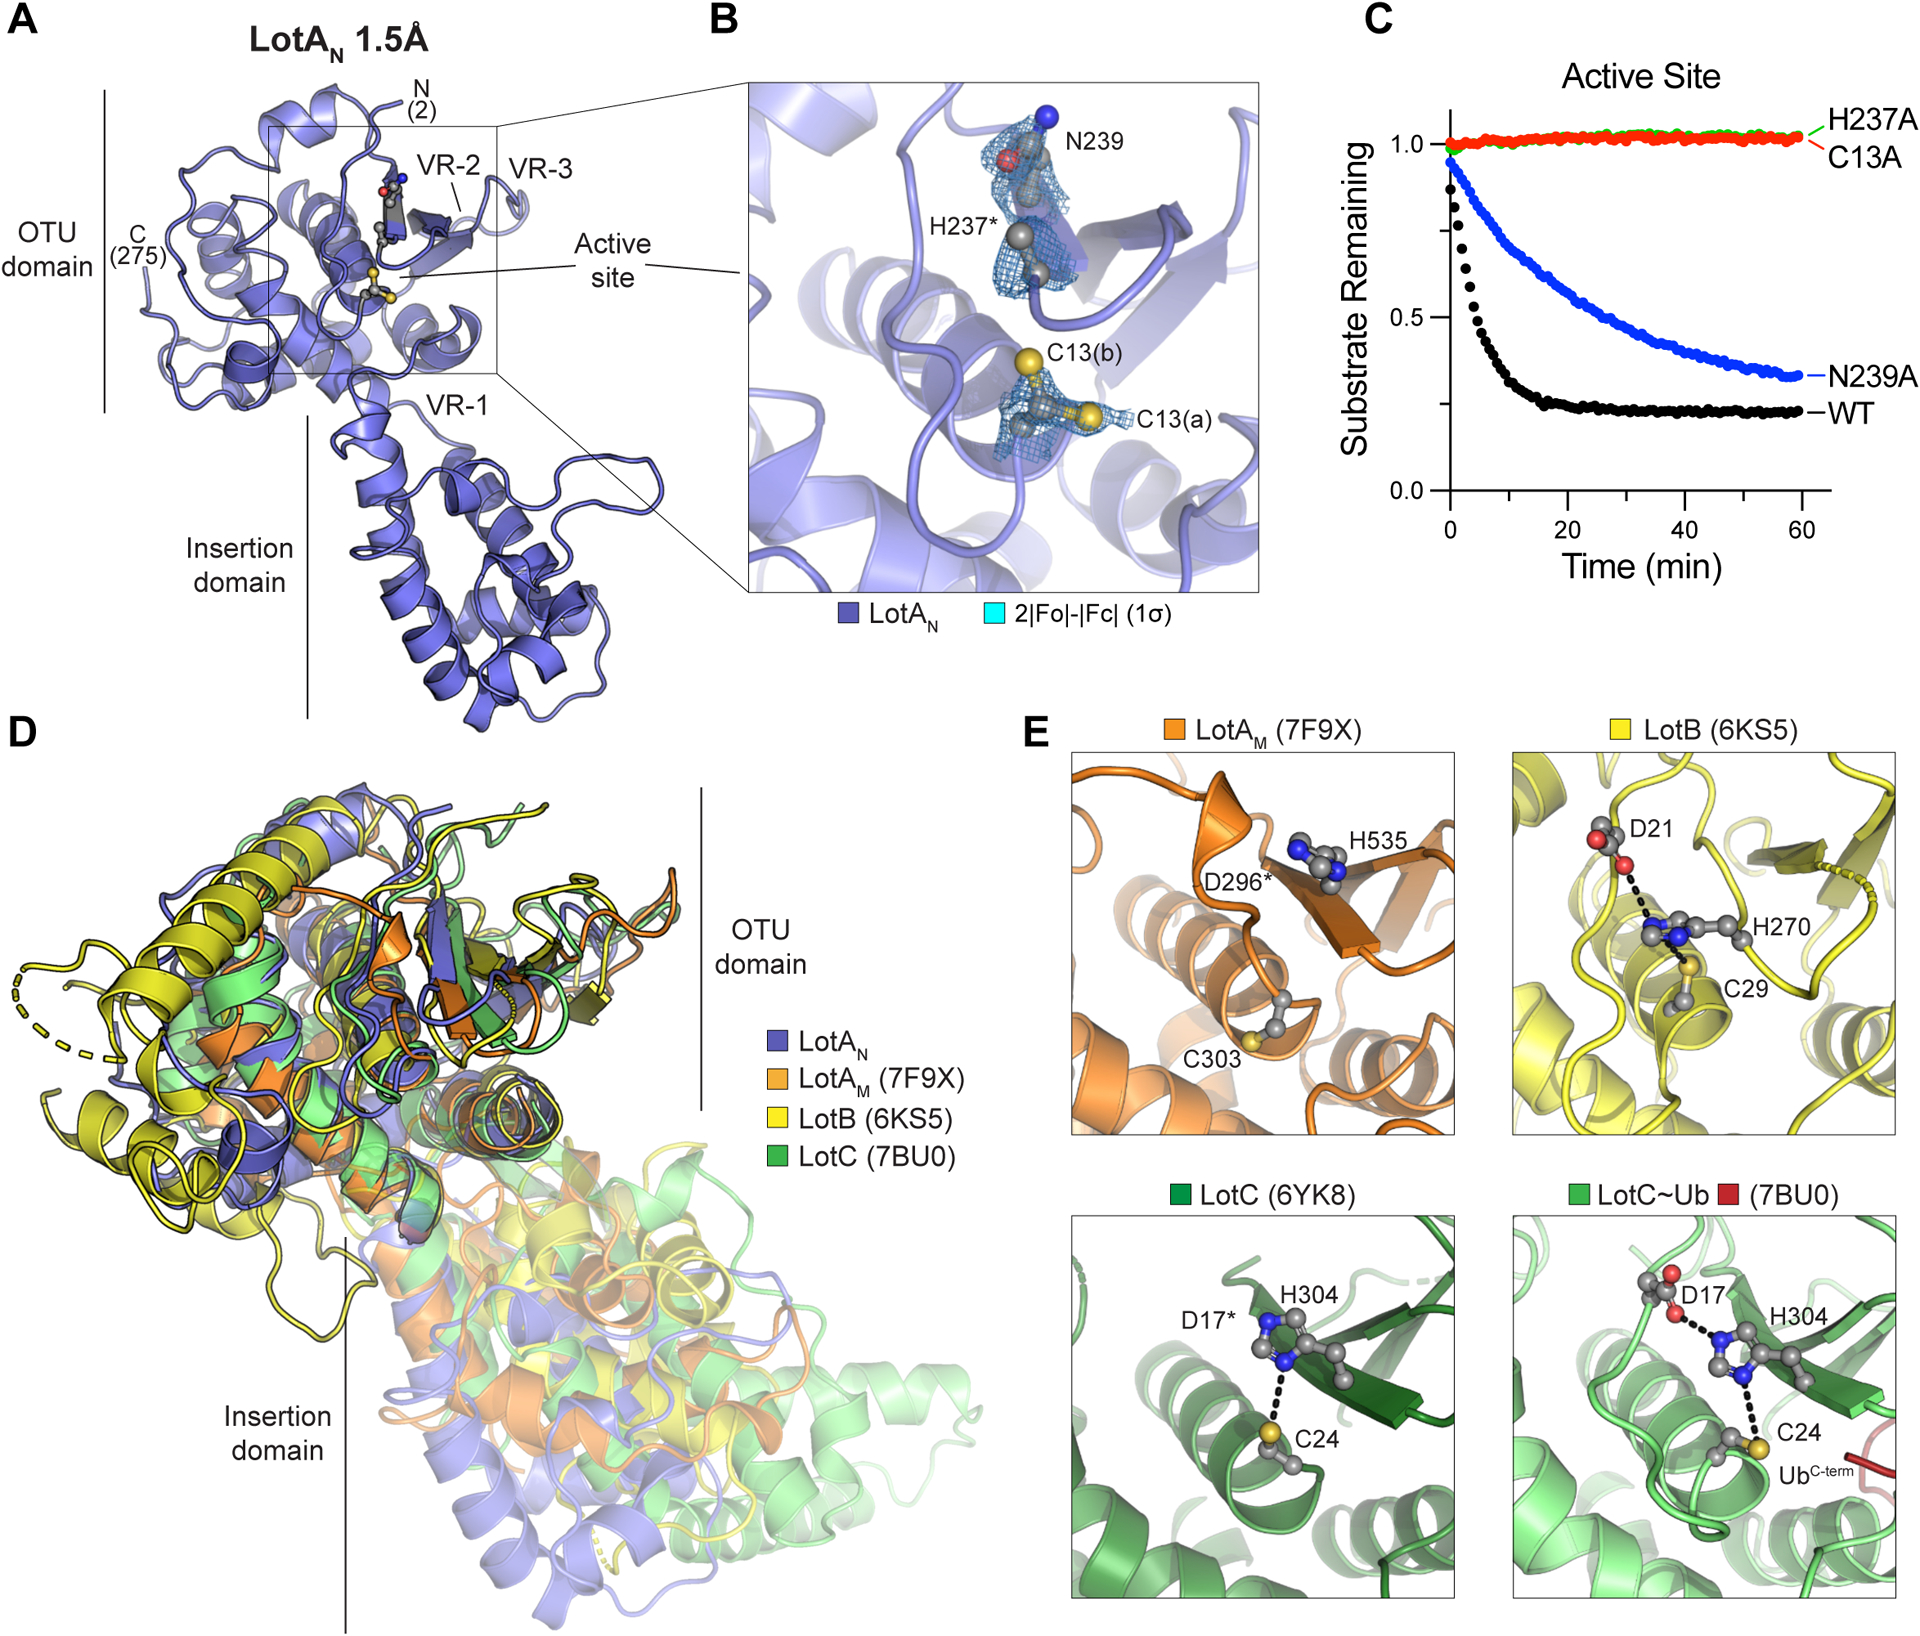
Figure 3: Crystal structure of the LotAN OTU domain.

A. 1.5Å crystal structure of LotA (1–294) labeled with visible termini, domain architecture, active site, and OTU variable regions (VR1–3) described previously32.
B. Close-up view of the LotAN active site with 2|Fo|-|Fc| electron density overlaid at 1σ for catalytic triad residues. Alternate conformations of the C13 side chain (a and b) are observed, whereas density for the H237 imidazole ring is absent.
C. Cleavage of fluorescent K6 diUb by the indicated LotAN active site variants at 10 nM concentration monitored by fluorescence polarization.
D. Structural overlay of LotAN (blue), LotAM (PDB 7F9X, orange), LotB (PDB 6KS5, yellow), and LotC (PDB 7BU0, green). Structures were aligned by their core OTU domains to demonstrate variability in the insertion domains.
E. Close-up views of the LotAM, LotB, LotC (PDB 6YK8), and Ub-bound LotC (PDB 7BU0) active sites. Catalytic triad residues are shown in ball-and-stick representation, with hydrogen bonds indicated by dashed lines.
See also Figure S3.
