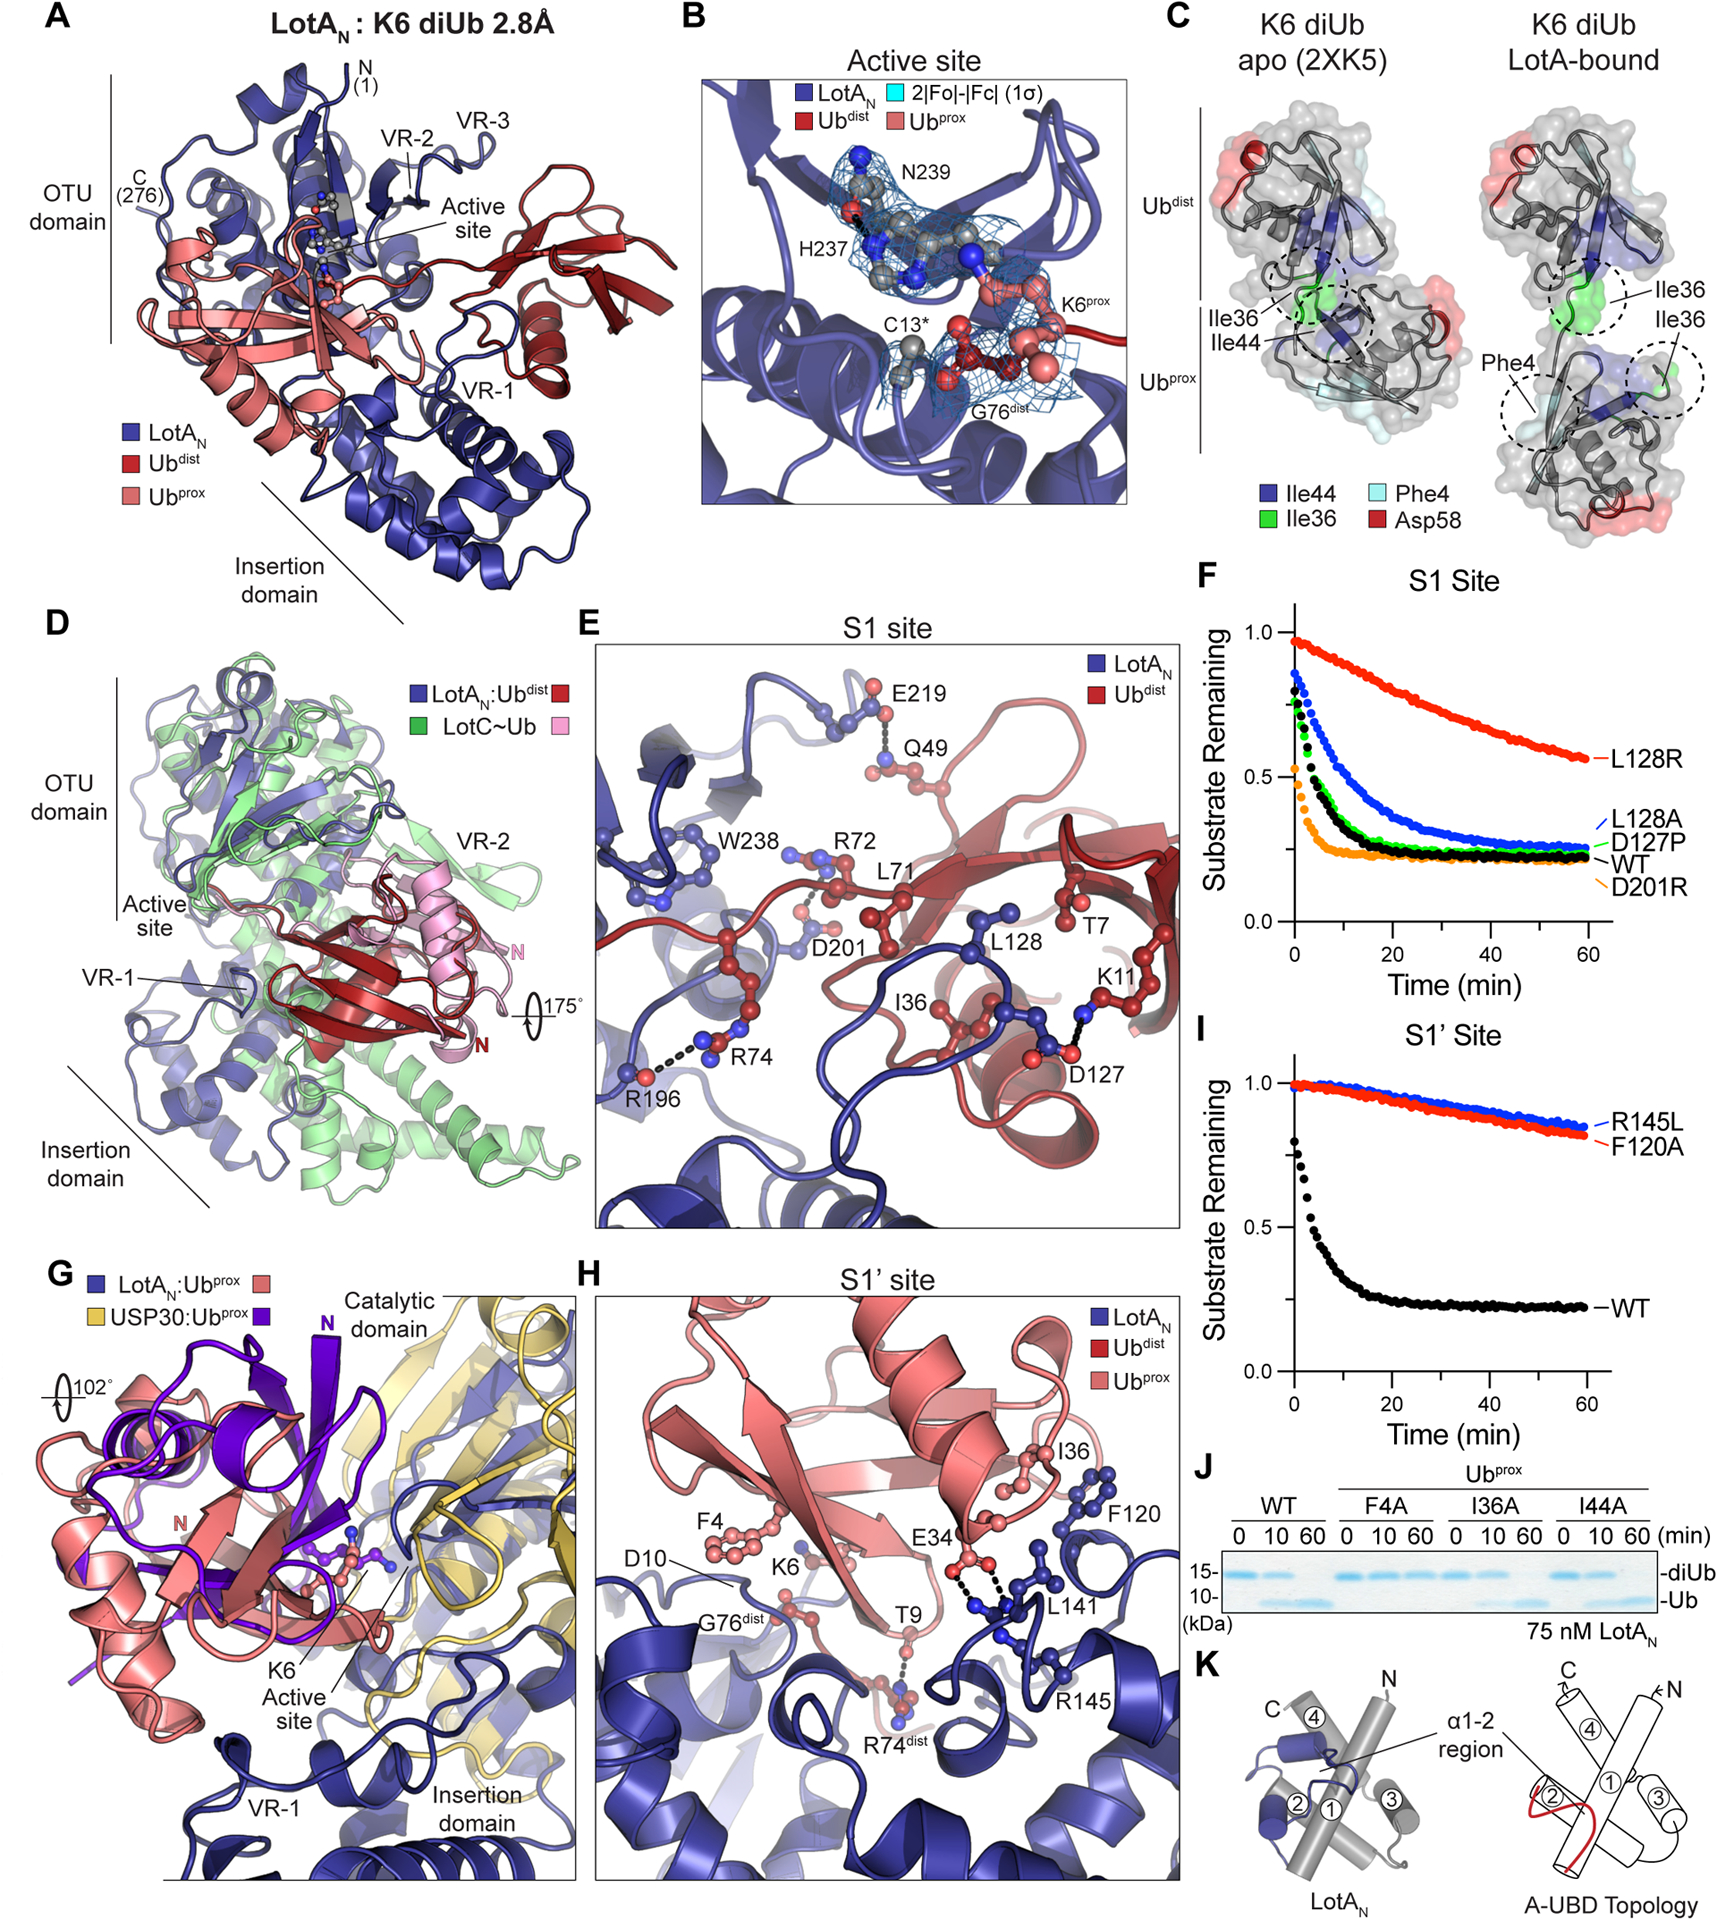
Figure 4: Crystal structure of the LotAN OTU domain bound to K6 diUb.

A. 2.8Å crystal structure of LotAN (1–276, blue) bound to K6 diUb (shades of red). The structure is labeled with visible termini, domain architecture, active site, and OTU variable regions (VR1–3).
B. Close-up view of the K6 diUb-bound LotAN active site with 2|Fo|-|Fc| electron density overlaid at 1σ for catalytic triad residues. The K6 side chain of Ubprox and C-terminus of Ubdist are also shown with overlaid electron density. The LotAN catalytically inactive C13A variant was used to preserve the diUb linkage.
C. Crystal structures of K6 diUb in isolation (PDB 2XK5) and bound to LotAN, aligned by their Ubdist moieties (top). Availability and orientation of common interaction surfaces are shown, with dashed circles indicating the surfaces utilized by either Ub:Ub or LotAN:Ub interaction.
D. Structural overlay of LotAN (blue) and LotC (green) bound to their respective distal Ub moieties (red and pink, respectively). The structures are aligned on their core OTU domains, and highlight large differences in Ub orientation, insertion domains, and use of variable regions.
E. Close-up view of the LotAN S1 site (blue) bound to Ubdist (red). Interacting residues are shown in ball-and-stick representation, with hydrogen bonds indicated by dashed lines.
F. Cleavage of fluorescent K6 diUb by the indicated LotAN S1 site variants at 10 nM concentration monitored by fluorescence polarization.
G. Structural overlay of LotAN (blue) and human USP30 (tan) bound to their respective distal Ub moieties (salmon and purple, respectively). The structures are aligned on their core catalytic domains, and highlight large differences in Ub orientation and features of their S1’ sites.
H. Close-up view of the LotAN S1’ site (blue) bound to Ubprox (salmon). Interacting residues are shown in ball-and-stick representation, with hydrogen bonds indicated by dashed lines.
I. Cleavage of fluorescent K6 diUb by the indicated LotAN S1’ site variants at 10 nM concentration monitored by fluorescence polarization. These data were collected in parallel with those presented in (F), and the WT dataset is shown again for reference.
J. Gel-based LotAN cleavage assay of K6 diUb variants with indicated Ubprox mutations. Reactions were quenched at the indicated times and visualized by SDS PAGE with Coomassie staining.
K. Underlying helical domain architecture of the LotAN (left) and stereotypical (right) adaptive Ub-binding domain (A-UBD), with helices labeled and the Ub-binding α1–2 regions shown in color.
See also Figure S4.
