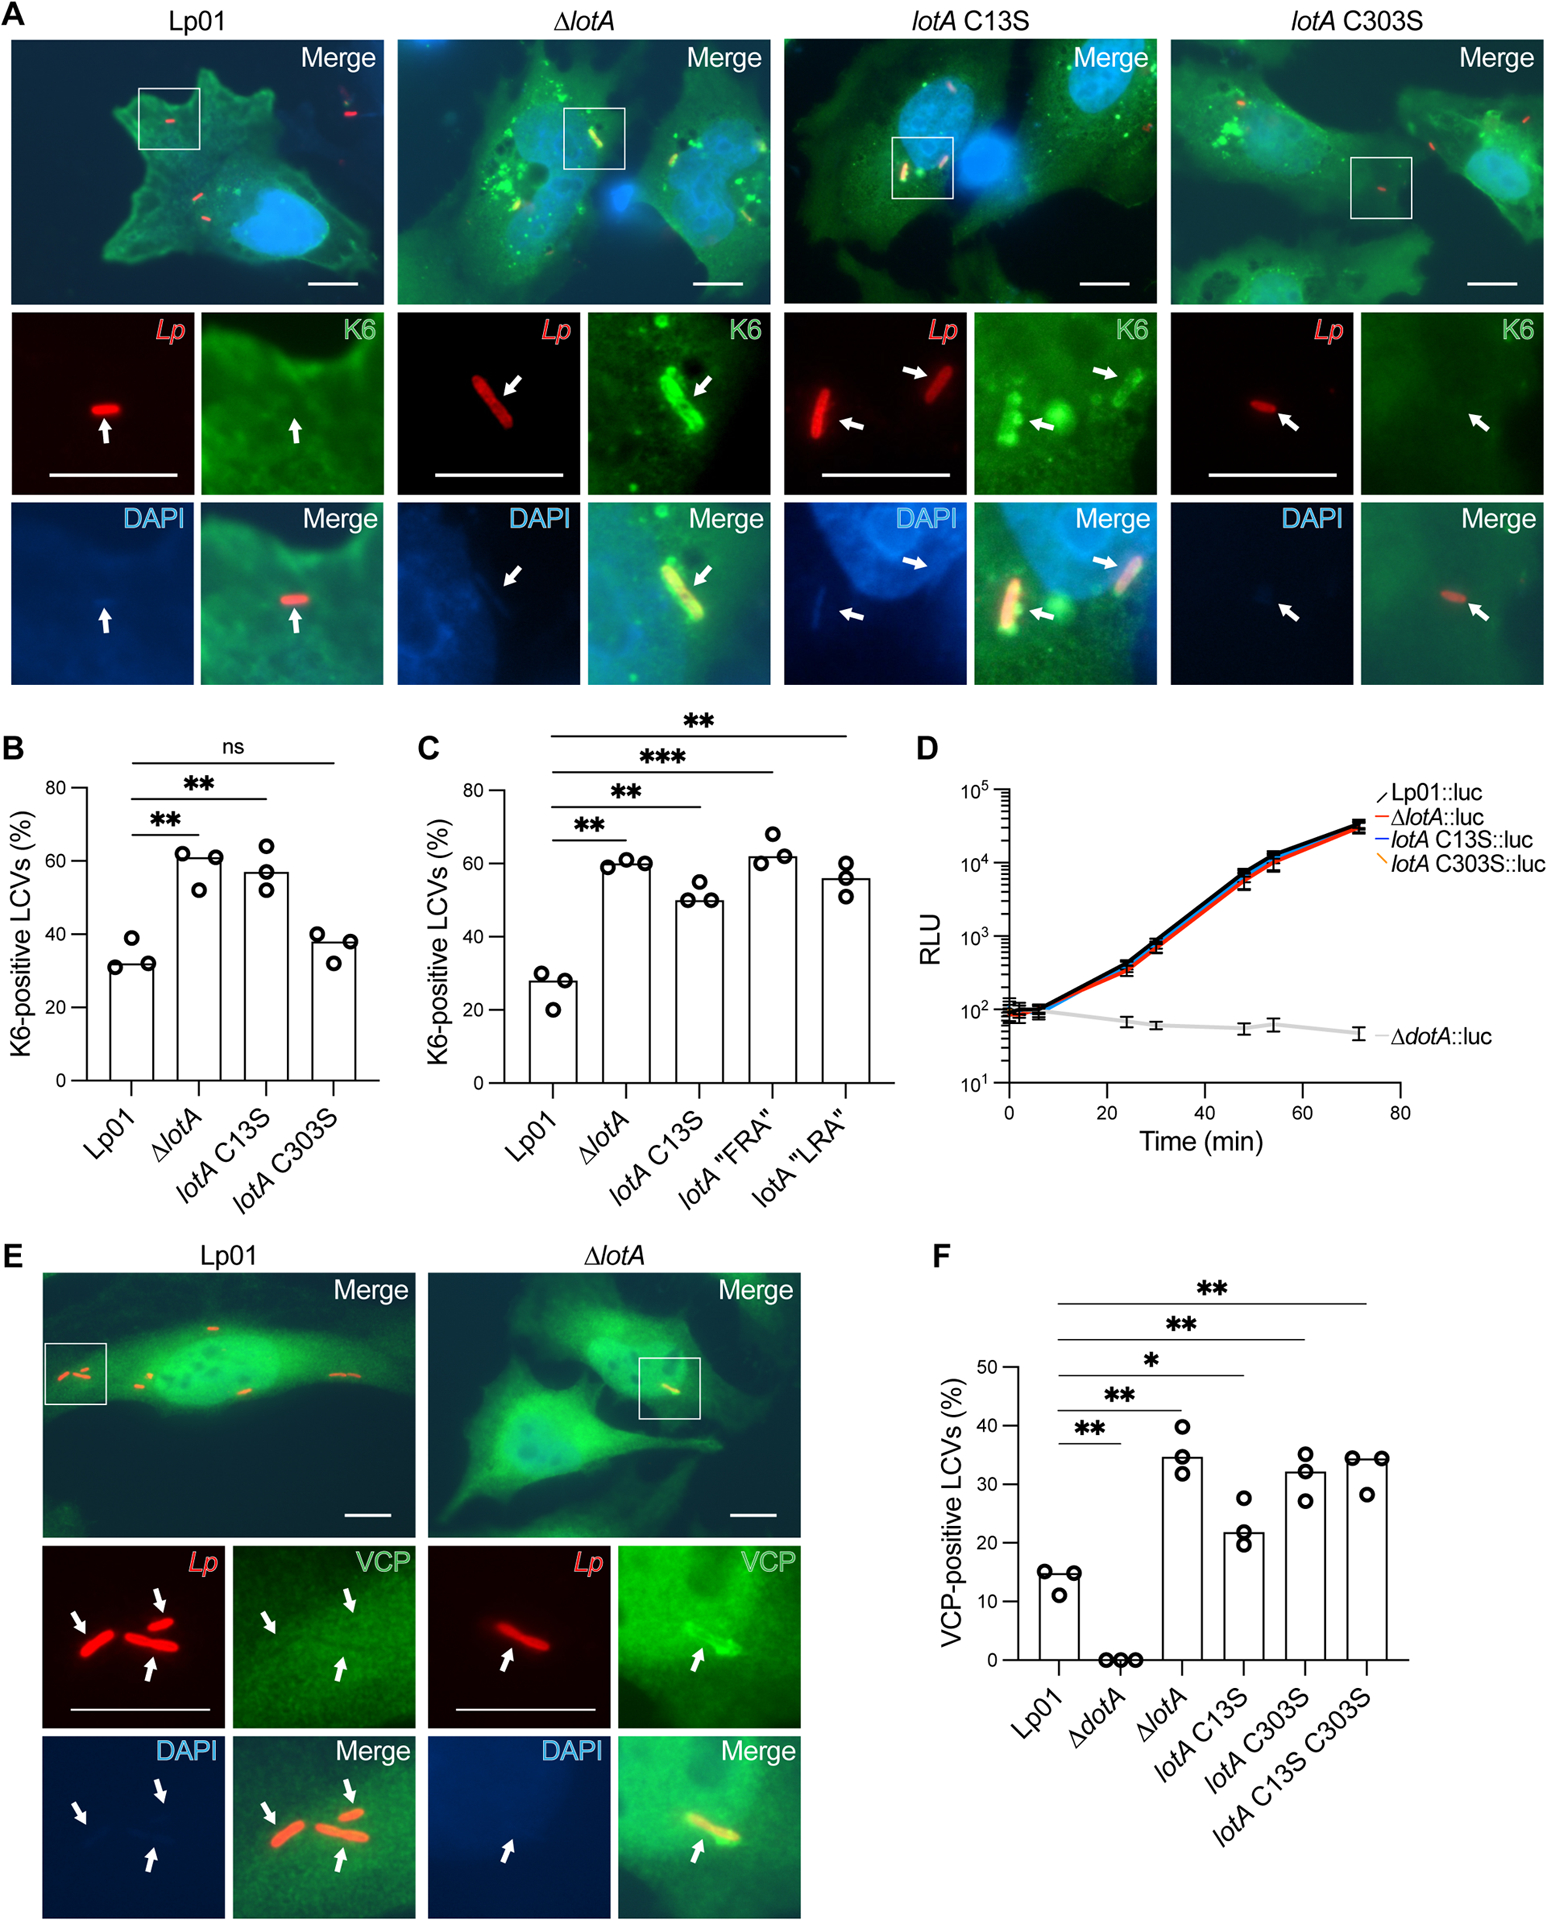
Figure 6: LotAN restriction of K6 polyUb during L. pneumophila infection.

A. Representative images of HeLa FcγRII cells infected with the indicated L. pneumophila strains at an MOI of 2 for 4 h. Fixed cells were stained for L. pneumophila (red), HA-Ub-K6 (green), and DNA (blue). Arrows indicate the position of a bacterium in each channel. Images were collected at 100x magnification. Scale bars correspond to 10 μm.
B. Quantitation of K6-positive bacteria shown in (A). Infections were performed in triplicate and each value represents scoring from 100 LCVs. Significance was determined using a Welch’s t-test.
C. Quantitation of K6-positive bacteria from HeLa FcγRII cells infected with the indicated L. pneumophila strains at an MOI of 2 for 4 h. Infections were performed in triplicate and each value represents scoring from 100 LCVs. Significance was determined using a Welch’s t-test.
D. Luciferase-expressing L. pneumophila strains were used to infect mouse BMDMs at an MOI of 0.5. Intracellular growth was monitored via bioluminescence changes over time. The mean relative luminescence unit (RLU) and standard deviation of eight independent experiments are shown.
E. Representative images of HeLa FcγRII cells infected with the indicated L. pneumophila strains at an MOI of 2 for 4 h. Fixed cells were stained for L. pneumophila (red), VCP (green), and DNA (blue). Arrows indicate the position of a bacterium in each channel. Images were collected at 100x magnification. Scale bars correspond to 10 μm.
F. Quantitation of VCP-positive bacteria shown in (E), alongside infections with a secretion-deficient ΔdotA strain and strains carrying mutations in the LotA active sites. Infections were performed in triplicate and each value represents scoring from 100 LCVs. Significance was determined using a Welch’s t-test.
See also Figure S6.
