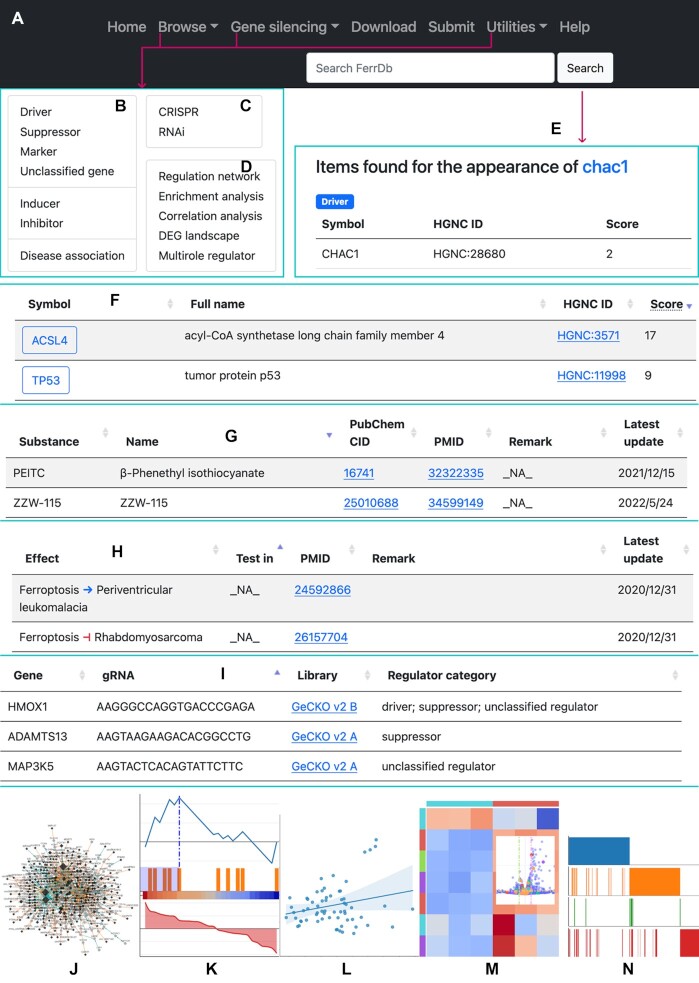
Figure 1.
Overview of FerrDb V2. (A) The navigation bar. (B) The expanded ‘Browse’ drop-down menu. (C) The expanded ‘Gene silencing’ drop-down menu. (D) The expanded ‘Utilities’ drop-down menu. (E) An example of searching ‘chac1’. (F) An example of a table of ferroptosis drivers. (G) An example of a table of ferroptosis inducers. (H) An example of a table of ferroptosis-disease associations. (I) An example of a table of CRISPR gRNAs. (J) A schematic presentation of the ‘Regulation network’ utility. (K) A schematic presentation of the ‘Enrichment analysis’ utility. (L) A schematic presentation of the ‘Correlation analysis’ utility. (M) A schematic presentation of the ‘DEG landscape’ utility. (N) A schematic presentation of the ‘Multirole regulator’ utility.

